Fig 6.
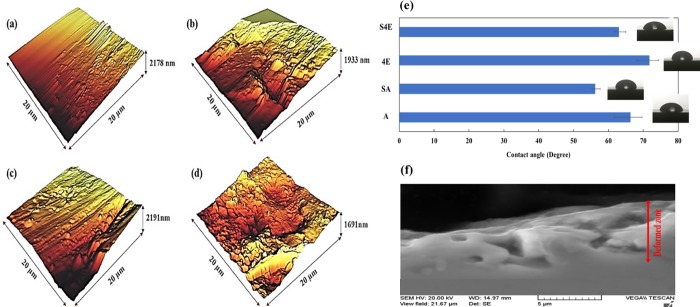
Surface properties of Ti samples; AFM topography of samples in 20*20 μm2 area, (a) A, (b) SA, (c) 4E, and (d) S4E sample; (e) contact angle results of Ti samples; (f) SEM micrograph of SMATed as-received Ti (SA) sample showing the SMAT effected zone full of micrometer ranged cracks and pores.

