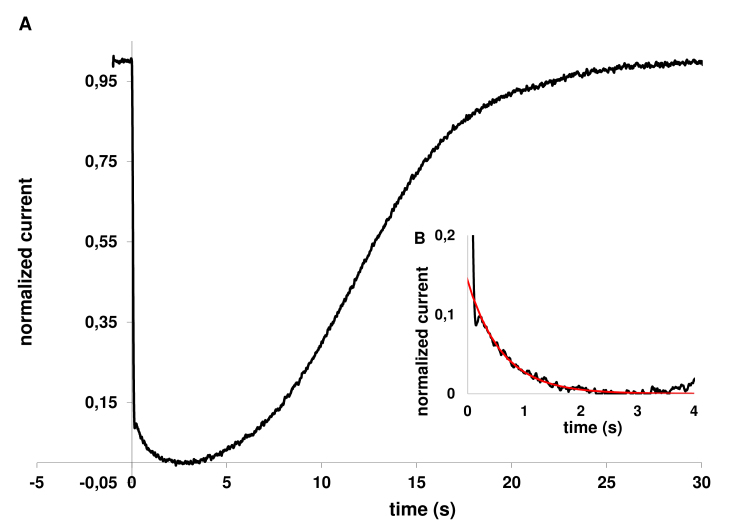
Figure 4.
Analysis of kinetics of light-induced calcium changes in rod outer segment in Ringer’s solution. A: An averaged response of four individual saturated responses. Each response was normalized to the corresponding dark current (~23 pA) and the average plotted “upside down” to show the circulating current. The flash intensities in these recordings were 2,220–3,520 photons ・ μm−2 per flash. B: The same response as in Figure 4A on an enlarged scale. The noisy black line shows the averaged response. The smooth red line is a single-exponential approximation.

