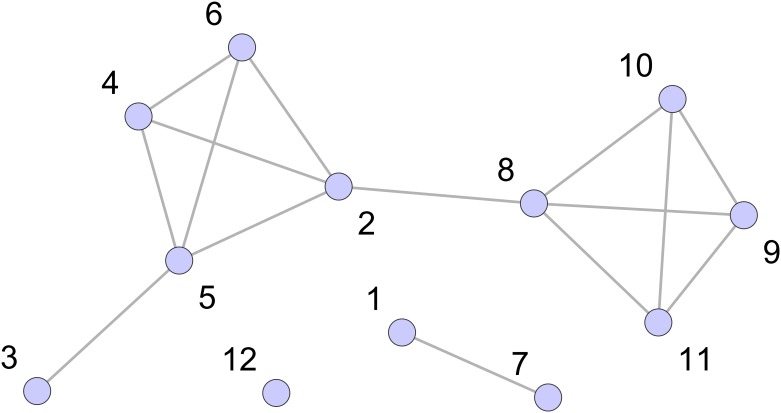
Fig 2. Shareholder network.
The “shareholder network” for the data displayed in Fig 1. This is the projection of the shareholder-company network onto just the shareholder nodes. The nodes here are just the shareholder nodes 1 to 12. An edge indicates that two shareholders have assets in common. For example, shareholders 3 and 5 have both invested in E, therefore, an edge between nodes 3 and 5 exists in this projected graph. Note that a simple network is used, edges have no directions and no weights, and there are no self-edges.

