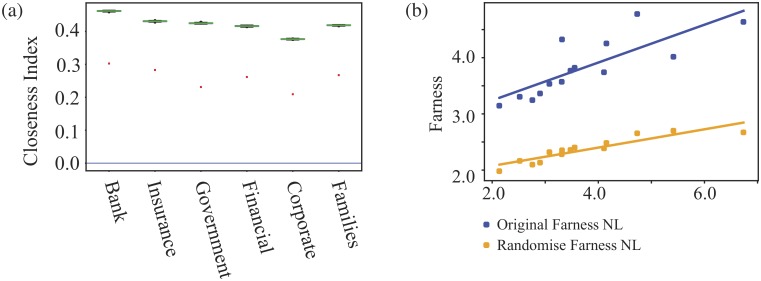
Fig 10. The average closeness indices for different types of shareholders in the LCC of Dutch shareholder network.
In Fig (a) we show the results for each shareholder with the red dots for the original data while the box plots are for the randomised data. In (b) each point shows the average ‘Farness’ (the inverse of closeness) of one shareholder type against log(N/k), where k is the average degree of nodes of that type. The higher blue points are for the original data, the lower orange points are for the randomised network. The lines in (b) are for a linear fit to the points. The slope of this fit to the original data is 0.34, 0.16 for the randomised network and the theoretical value in a random branching model is 0.17.

