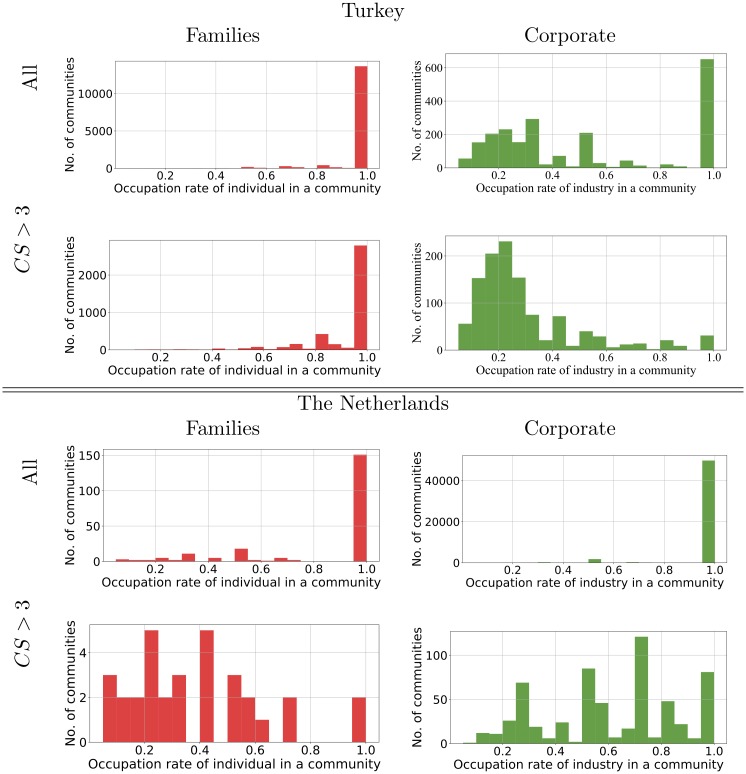
Fig 13. The number of communities found with a given fraction of one type of shareholder.
The communities are found with Infomap in the shareholder network for Turkey and Netherlands. On the left we have the fraction of Family shareholders in different communities while on the right we have the fraction of Corporate shareholders in each community. The figures in first row includes community of all sizes. The fat-tailed distribution means this is dominated by the large number of small communities, and these are almost always of a single type of shareholder, hence the peak at 1.0. The second row shows the same analysis done when we exclude small communities which have three or less nodes (CS = community size). Similar analysis for the Louvain community detection method is given in the S1 Appendix.

