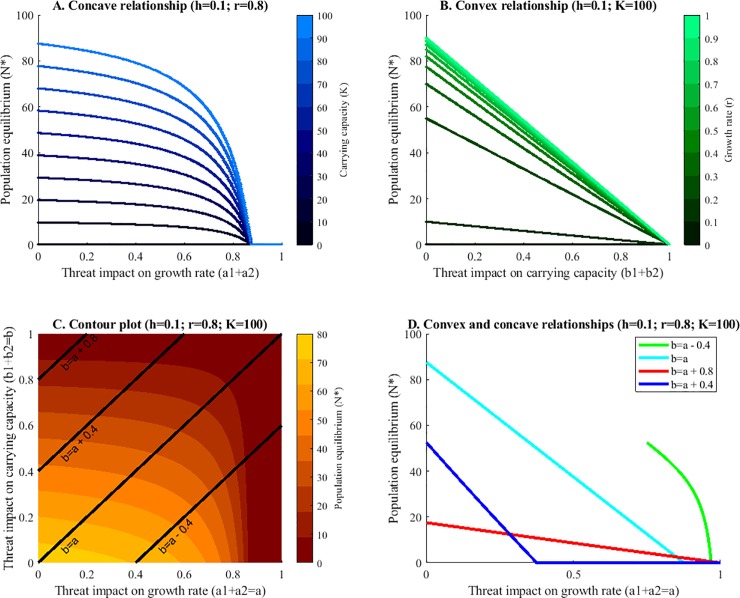
Fig 3.
Relationships between the threat impacts on (A) growth rate, (B) carrying capacity, (C&D) growth rate and carrying capacity and the population equilibrium. Part A. shows a concave relationship between the threats impacting the growth rate and the population equilibrium for all levels of the carrying capacity. Part B shows a linear relationship between magnitude of impact on the carrying capacity and the population equilibrium for all magnitudes of the growth rate. Part C shows a contour graph of the population equilibrium with varying threats impacting the growth rate and the carrying capacity. Furthermore, slices are highlighted (lines) that are displayed in Part D. The x-axis in part D represents the magnitude of the impact of the threats on the growth rate. The threats impacting the carrying capacity are also varied and can be identified using the appropriate linear function to calculate b. Part D shows that depending on the slice we choose from Part C both concave and convex (here piecewise linear) relationships can be found when all threat impacts are varied.

