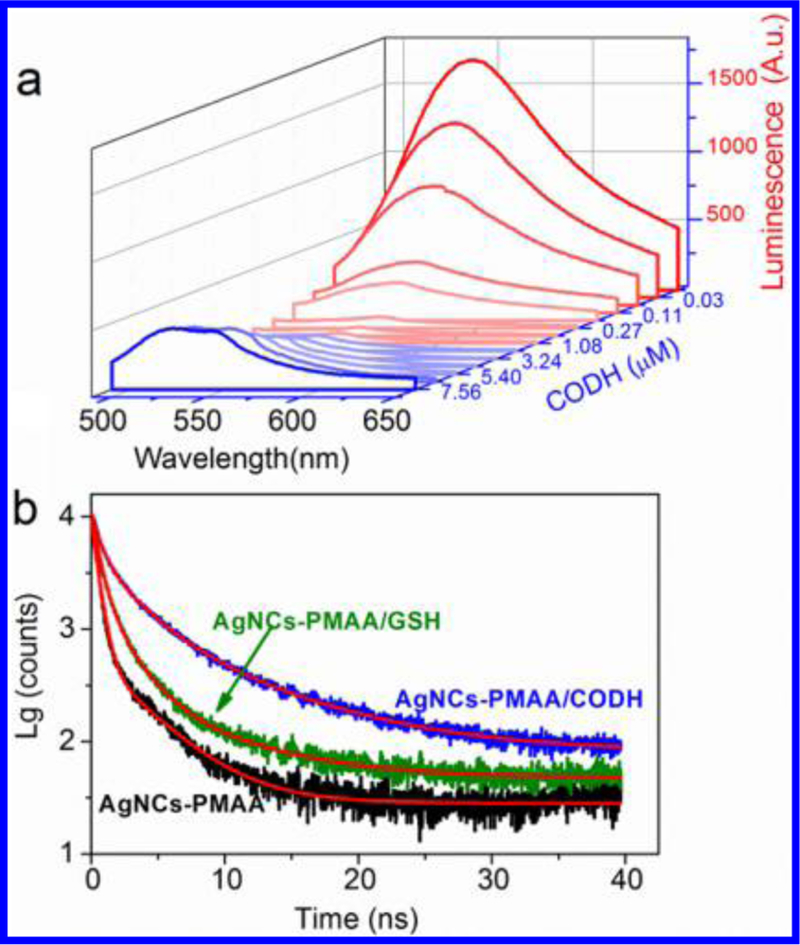
Figure 3.

Interaction between AgNCs-PMAA and CODH. (a) Photoluminescence spectra of AgNCs-PMAA (Ag atom concentration 20 μM determined by ICP-MS) using CODH (0−7.56 μM) in 0.2 M MES bu ffer (0.5 mL, pH 6.0) with λex 460 nm. (b) Fluorescence decay traces of AgNCs-PMAA monitored at 460 nm. Black, green, and blue traces are for AgNCs-PMAA, AgNCs-PMAA/glutathione (GSH), and AgNCs-PMAA/CODH, respectively, in 0.2 M MES, pH 6, at room temperature. Fits are shown in red.
