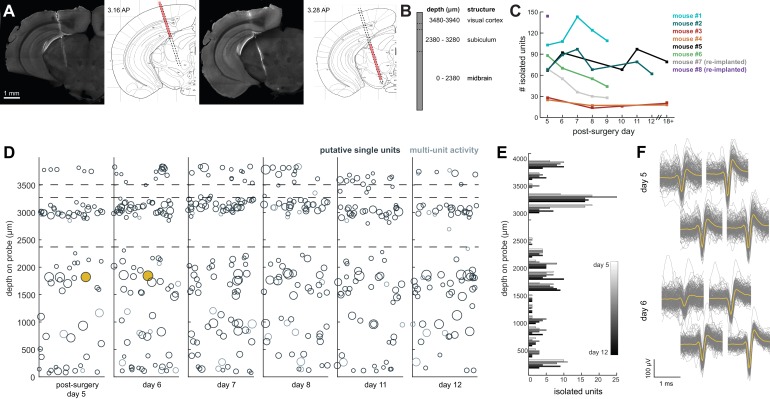
Figure 4. Chronic Neuropixel probe implants in cortex and subcortical regions can record ~20–145 units across multiple days.
(A) Probe location, marked with DiI. Sections from Paxinos and Franklin atlas provided for reference. Mouse #200 was implanted with a probe in visual cortex, hippocampus (subiculum), and the midbrain. (B) Schematic of probe depth in (A). (C) Number of isolated units across recording days for eight different mice. Mouse #3 and #4 were implanted with a probe with fewer recording sites (270 vs. 374). Mouse #2 is featured in the other panels of this figure. Mouse #7 had a probe that was previously implanted in Mouse #5; see Figure 6. (D) Scatter plot of units across days for Mouse #2. Size of circles denotes number of waveforms assigned to that unit. X axis is random for visualization. € Histogram of isolated units across days and brain depth for Mouse #2. (F) Waveforms (n = 200, mean waveform in yellow) recorded from the same four contacts on the probe on day 5 (top) and day 6 (bottom). Units are the same as the yellow filled in circles in (D).

