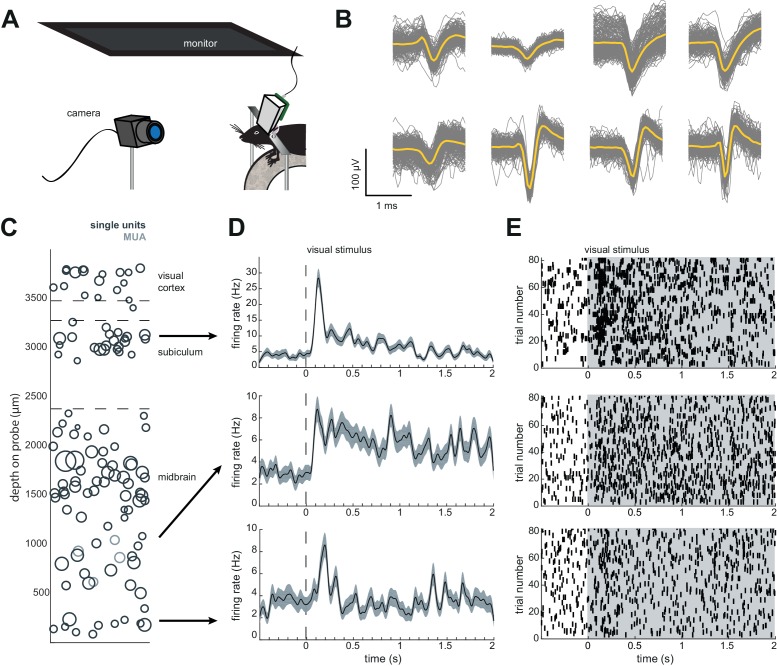
Figure 5. Implant design enables researchers to further characterize brain regions recorded during freely moving behavior.
(A) Schematic of headfixed setup. The mouse was implanted with a headbar (see Materials and methods) enabling it to be restrained above a wheel. Visual stimuli was presented on a monitor above the mouse’s head (similar to the unrestrained condition). The mouse’s pupil can be tracked with a high resolution IR camera, and movement can be tracked using a rotary encoder on a 3D printed wheel. (B) Eight sample waveforms (n = 200, mean in yellow) from a restrained recording, same mouse as Figure 4D–F (Mouse #2). (C) Distribution of sorted units across the probe, same mouse as in Figure 4D–F (Mouse #2). (D) Peristimulus time histograms for three example neurons from different locations on the probe. The stimuli were a pseudorandomized set of 2 s full contrast sinusoidal drifting gratings in eight different directions. Shaded region is standard error of the mean. Stimuli began at the dotted line. (E) Raster plots for the neurons in (D). Shaded area indicates the duration of the stimulus.

