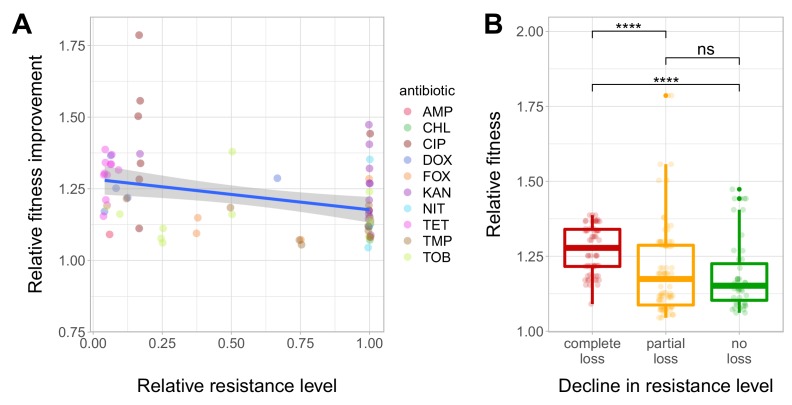
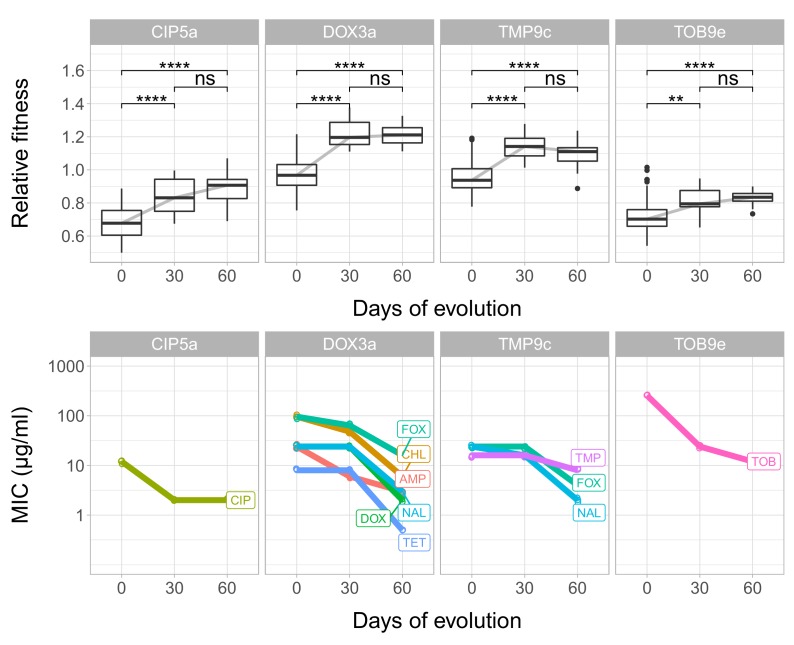
Figure 4. Fitness recovery and resistance loss after compensatory evolution.
(A) The scatterplot shows the relative resistance level and relative fitness improvement of individual T60 strains compared to the corresponding T0 strains (each data point is one strain, the colors indicate the antibiotic used in the analysis). Relative resistance was estimated by the minimum inhibitory concentration of the T60 line relative to that of the T0 line. There is a significant negative correlation between relative fitness improvement and relative resistance level (Spearman’s correlation test, ρ = −0.35, p=0.0031). Blue line with gray shaded area represents linear regression line with 95% confidence interval. For antibiotic abbreviations, see Table 1. Source file is available as Figure 4—source data 1. (B) Resistance loss as a function of relative fitness in antibiotic-free environment. The T60 strains were classified into three main categories based on their resistance-profiles: the resistance level declined against all tested antibiotics (complete), declined towards at least one antibiotic (partial), or the resistance level was maintained (no). Using the CLSI resistance break-point cut-offs (CLSI Approved Standard M100, 29th Edition), we categorized each T60 and the corresponding T0 strains as being resistant (R), intermediate (IM) or susceptible (S) to each investigated antibiotic. A decline in resistance was defined by transitions R->IM, R->S or IM->S. We observed a significant association between the relative fitness in the antibiotic-free medium and the decline in resistance level (Mann-Whitney U-test: **** indicates p<0.0001, ns indicates that the p value is non-significant). Boxplots show the median, first and third quartiles, with whiskers showing the 5th and 95th percentiles. Source file is available as Figure 4—source data 1.


