. 2019 Aug 16;8:e47088. doi: 10.7554/eLife.47088

Figure 5. Phenotypic effects of a compensatory mutation in the marR promoter region.

The figure shows the (A) relative fitness, (B) relative resistance level and (C) Relative Hoechst probe accumulation (a proxy of membrane permeability) in the doxycycline-resistant T0 and the corresponding T60 strain harboring a compensatory mutation in the marR promoter region (marR*). Additionally, marR* was introduced into the wild-type and T0 genetic backgrounds as well, yielding WT + marR* and T0 + marR* strains, respectively. (A) Fitness was measured as the area under the growth curve in an antibiotic-free medium, and was normalized to wild-type fitness. Boxplots show the median, first and third quartiles, with whiskers showing the 5th and 95th percentiles (2 biological and five technical replicates per each genotype). We observed a significant variation in relative fitness across the strains (Tukey’s post-hoc multiple comparison tests, * indicates p<0.05). Source file is available as Figure 5—source data 1. (B) Resistance level of all five strains against six antibiotics. Minimum inhibitory concentration (MIC) was measured by the standard E-test assay, and was normalized to that of the wild-type strain. Only the T0 strain can be considered resistant to each antibiotic tested according to the CLSI resistance break-point cut-off. Source file is available as Figure 5—source data 1. (C) Membrane permeability across five strains. Membrane permeability was estimated by measuring the intracellular accumulation of a fluorescent probe (Hoechst 33342) in eight biological replicates per each strain or condition. Intracellular accumulation of the probe in the corresponding strains was normalized to that of the wild-type strain. Wild-type cells treated with a protonophore chemical agent (carbonyl cyanide m-chlorophenyl hydrazone, CCCP) served as a positive control, displaying an 88% larger membrane permeability value compared to that of the non-treated wild-type strain. T0 showed an exceptionally low level of Hoechst-dye accumulation compared to all other strains studied, while T0 + marR* displayed a 166% larger membrane permeability value compared to that of the T0 strain (Tukey’s post-hoc multiple comparison tests: **** indicates p<0.0001). Boxplots show the median, first and third quartiles, with whiskers showing the 5th and 95th percentiles. Source file is available as Figure 5—source data 1.

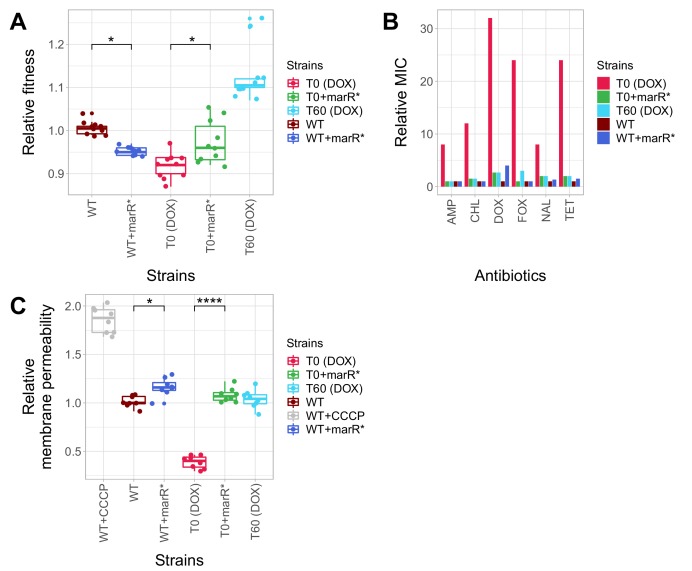
Figure 5—source data 1. Relative fitness, relative MIC and relative Hoechst-dye accumulation of reconstructed mutant strains.
DOI: 10.7554/eLife.47088.016

Figure 5.

Figure 5—figure supplement 1. Functional relationship of resistance-conferring and compensatory mutations in representative evolved lines.

Figure 5—figure supplement 1.

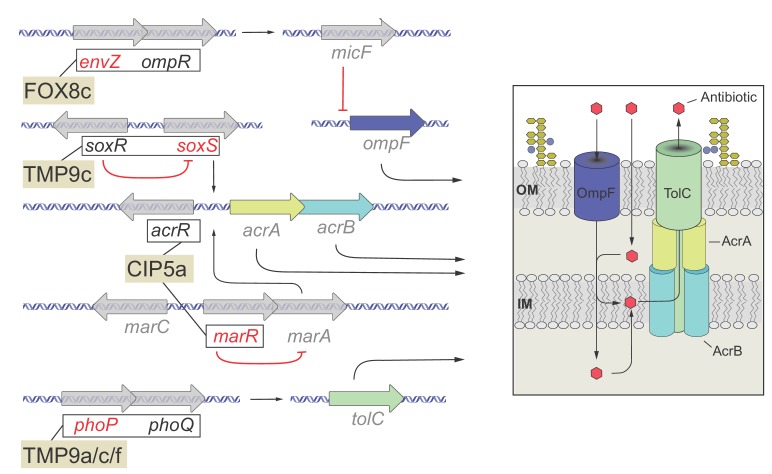
The figure depicts the functional relationship of selected T0 and T60 mutations in certain evolved lines. The genes are color-coded: gene names in black are mutated only in T0, gene names in red are mutated only in the T60, while gene names in gray are not mutated either in T0 or T60 and used only for illustrative purposes. Mutations found in genes with established functional relationship are connected with black lines within evolved lines (FOX8c, TMP9c, CIP5a, TMP9a/c/f). Connection between ompR-EnvZ (FOX8b): A cefoxitin-resistant T0 line carries a resistance-conferring mutation in the transcriptional regulatory protein OmpR. OmpR modulates the expression of major outer membrane protein genes, and forms a two-component regulatory system with the sensory histidine kinase EnvZ, a protein mutated in the corresponding T60 line. Connection between PhoQ/SoxR – PhoP/SoxS (TMP9c): A trimetoprim-resistant T0 lines carries a mutation in the sensory histidine kinase PhoQ and the redox–sensitive transcriptional activator SoxR, whereas the T60 line carried compensatory mutations in genes phoP (response regulator in two–component regulatory system with PhoQ) and soxS (superoxide response regulon transcriptional activator). Connection between AcrR-MarR (CIP5a): Mutation in the transcriptional repressor AcrR most likely confers ciprofloxacin-resistance in T0 through activating the AcrA/AcrB/TolC multidrug-efflux system, while a compensatory mutation appeared in MarR, that controls the activity of the mar regulon. The mar regulon is responsible for regulating several genes involved in antibiotic-resistance, including those that encode components of the AcrA/AcrB/TolC multidrug-efflux system. Source file is available as Supplementary file 1.
Figure 5—figure supplement 2. Effect of a compensatory mutation in envZ.

Figure 5—figure supplement 2.

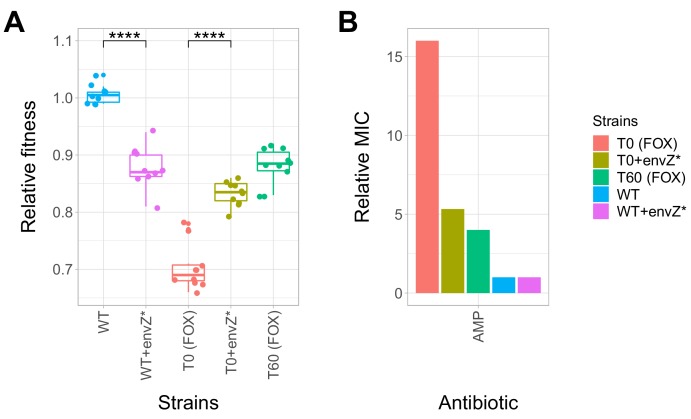
The figure shows the (A) relative fitness and (B) relative resistance level of the following strains: wild-type (WT) E. coli K-12 BW25113, a cefoxitin-resistant T0 strain, the corresponding T60 strain carrying the compensatory mutation in envZ (envZ*). Additionally, envZ* was introduced into the wild-type and T0 genetic backgrounds, yielding WT + envZ* and T0 +envZ* strains, respectively. (A) Fitness was measured as the area under the growth curve, and was normalized to wild-type fitness. Boxplots show the median, first and third quartiles, with whiskers showing the 5th and 95th percentiles (two biological replicates each). As expected, relative fitness showed significant variations across the strains (Tukey’s post-hoc multiple comparison tests, **** indicates p<0.0001). Source file is available as Figure 5—source data 1. (B) Resistance level of all five strains against ampicillin (AMP). Minimum inhibitory concentration (MIC) was measured by the standard E-test assay, and was normalized to that of the wild-type strain. Only the T0 strain can be considered resistant to each antibiotic tested according to the CLSI resistance break-point cut-off. Source file is available as Figure 5—source data 1.