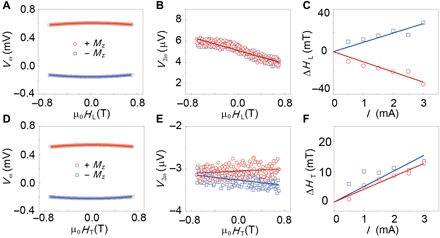
Fig. 3. Characterization of the current-induced effective fields.

(A and B) First and second harmonic voltages for the longitudinal effective field. HL is the applied longitudinal magnetic field along the current direction (x axis). (D and E) First and second harmonic voltages for the transverse effective field. HT is the applied transverse magnetic field transverse to the current direction (y axis). (C and F) Plots of the longitudinal and transverse field as a function of the peak current. The solid lines represent the linear fitting result with zero intercept. The red circles (blue squares) are data points for the Mz > 0 (Mz < 0). In the bilayer device, applying a current of 1 mA corresponds to a current density of 1.85 × 10¹⁰ A/m2 in the Pt layer.
