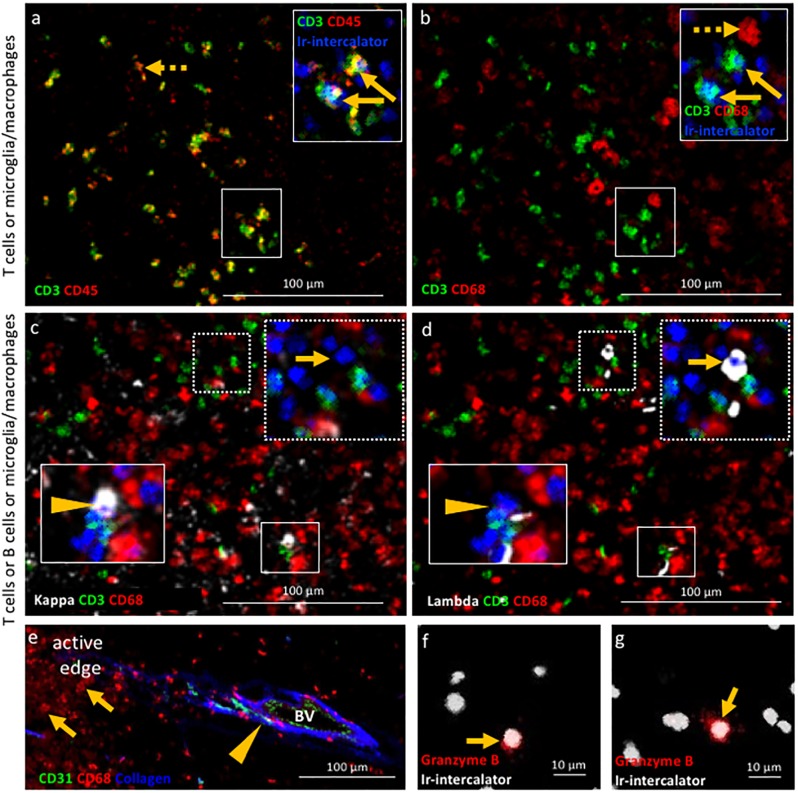
Figure 2. Validation of IMC specificity in MS lesions.
(a) Overlay of CD3 (green) and CD45 (red) identifies CD3+CD45+ T cells (solid arrows) and CD3-CD45+ leukocytes other than T cells (dotted arrow). (b) Overlay of CD3 (green) and CD68 (red) identifies CD3+CD68- T cells (solid arrows) and CD3-CD68+microglia/macrophages (dotted arrow). Note that the solid arrows in a and b indicates the same CD3+CD45+CD68- T cells. (c) Overlay of κ (white), CD3 (green) and CD68 (red) and (d) overlay of λ (white), CD3 (green) and CD68 (red) identify κ+CD3-CD68- B cells (arrow head in c) that are λ-CD3-CD68- (arrow head in d) and κ-CD3-CD68- B cells (arrow in c) that are λ+CD3-CD68- (arrow in d), as expected based on the allelic exclusion of κ and λ. (e) Overlay of CD31 (green), CD68 (red) and Collagen (blue) identifies CD31+Collagen+CD68- endothelial cells (arrow head) and CD31-Collagen-CD68+ microglia/macrophages (arrows). (f, g) Granzyme B+ cells (arrows). Images in (a and b) as well as images in c) and d) are from the same areas of an active demyelinating lesion. Image in (e) are from the edge of an active demyelinating lesion. Images in (f and g) are from the center of an active demyelinating lesion.


