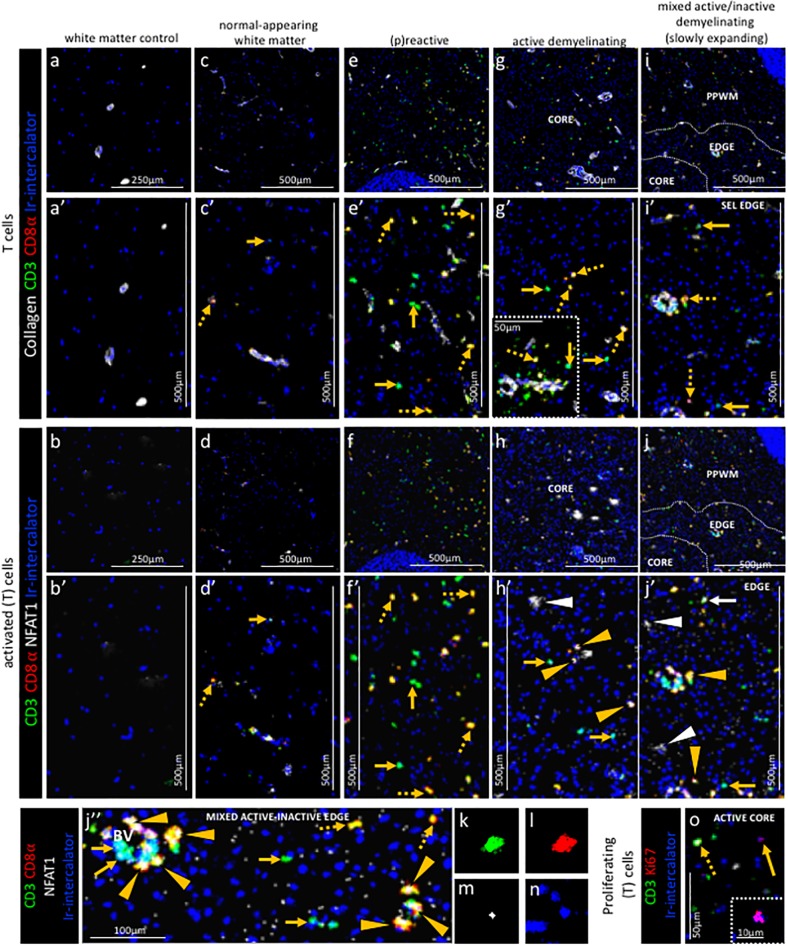
Figure 5. Pattern of T cell subpopulations in different stages of MS lesions by IMC.
Representative mass cytometry images of (a, a’, b, b’) white matter of control, (c, c’, d, d’) normal-appearing white matter (block no. CR4A), (e, e’, f, f’) (p)reactive lesion (block no. CR4A), (g, g’, h, h’, o) active demyelinating lesion (block no. CR4A) and (i, i’, j–n) mixed active-inactive demyelinating lesion (block no. CL3A). For each region of interest, we show the same area simultaneously labeled with anti-collagen antibodies to visuzliae blood vessels, all T cells (CD3), CD8α T cells, cell proliferation (Ki67) and DNA (Ir-intercalator). (a, a’– i, i’) Overlay of collagen (white), CD3 (green), CD8α (red) and Ir-intercalator (blue) identifies (dotted arrows in c’, e’, g’ and i’) CD3+CD8α+ T cells, (solid arrows in c’, e’, g’ and i’) CD3+CD8α- (therefore by exclusion putative CD4+) T cells and collagen+ blood vessels. (b–b’–j, j’’) Overlay of CD3 (in green), CD8α (red), NFAT1 (in white) and Ir-intercalator (in blue) identifies (yellow arrow head in h’, j’ and j’’) CD3+CD8α+NFAT1+ T cells and (white solid arrow in j’) CD3+CD8α-NFAT1+ (putative CD4+) T cells. (white arrow head in h’ and j’) CD3-CD8α-NFAT1+ cells are also detected. (o) Overlay of CD3 (in green), Ki67 (red) and Ir-intercalator (in blue) identifies CD3+Ki67+ proliferating T cells (dotted arrow) and CD3-Ki67+ proliferating cells other than T cells (solid arrows and inset). PPWM, periplaque white matter.

