. 2019 Aug 1;8:e48051. doi: 10.7554/eLife.48051

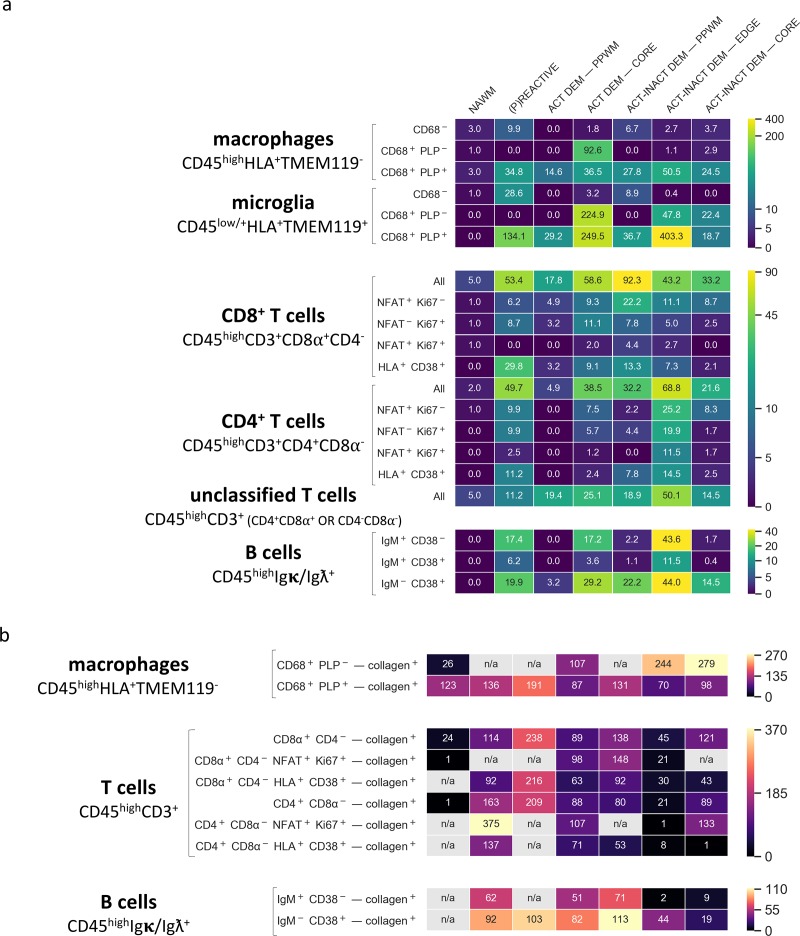
Figure 7. Density of immune cell subsets in different stages of MS lesions and their distance from blood vessels by IMC.

(a) Cell counts are provided as number of cells per mm2 (Barnett and Prineas, 2004) of region of interest. The category of cells is defined according to the expression of cell-specific and functional markers as indicated and also described in Table 2. (b) Distance between defined categories of cells and blood vessels (collagen+) are provided in μm. NAWM, normal-appearing white matter; PPWM, periplaque white matter; Act dem, active demyelinating; act inact dem, active-inactive demyelinating. The single-cell segmentation strategy is shown in Figure 7—figure supplement 1. The Positive and negative ‘gates’ used to identify each cell subset were established based on the quadrants defined by manually-identified cells according to the pipeline shown in Figure 7—figure supplements 24 and laid out in Figure 7—figure supplement 5. Please see the section ‘Gating strategy for quantitative analysis of T cell, B cell, macrophage and microglial cell subsets’ in the Materials and methods. The gating strategy used for the generation of heat maps is laid out in Figure 7—figure supplement 6. Source files used for the quantitative analysis are provided in Figure 7—source data 1.

Figure 7—source data 1. Source file for quantitative data of all ROI.
ROI 2 from block 95–056 (white matter control) ROI one from block CL3a (active lesion) ROI 2.1 from block CL3a (mixed active-inactive lesion) ROI 2.2 from block CL3a (mixed active-inactive lesion) ROI three from block CL3a (mixed active-inactive lesion) ROI four from block CL3a (active lesion) ROI two from block CR4a (mixed active-inactive lesion) ROI four from block CR4a (active lesion) ROI eight from block CR4a (normal-appearing white matter) ROI three from block CR4a (active lesion) ROI one from block CR4a ((p)reactive lesion) ROI five from block CR4a (active lesion) ROI six from block CR4a (mixed active-inactive lesion).
DOI: 10.7554/eLife.48051.021

Figure 7.

Figure 7—figure supplement 1. Single cell segmentation and validation of approach using anti-CD3.

Figure 7—figure supplement 1.

A Gaussian blur was applied to the DNA signal (nucleus detection - a), and the resulting blurred image was segmented to identify nuclear content corresponding to individual cell areas using a combination of threshold and watershed filters (cell simulation - b). Subsequently, we interrogated the segmented image for the presence of specific markers or combinations of markers that are either biologically co-expressed, or whose expression is mutually exclusive. In this example we show CD3 (example of validation - c).
Figure 7—figure supplement 2. Manual selection of myeloid cells.

Figure 7—figure supplement 2.

(a) Representation of manually-annotated cells in an active lesion, based on the detection of nuclei. (b) Segmented cells. (c–h) Identification of cells that express (for example CD45+HLA+) or do not express (for example Igκ/Igλ-CD3-) a biologically relevant set of markers. (i) Classification of myeloid cells. Purple arrows were used throughout (c–i) to track myeloid cells.
Figure 7—figure supplement 3. Manual selection of T cells.

Figure 7—figure supplement 3.

(a) Representation of manually-annotated cells in an active lesion, based on the detection of nuclei. (b) Segmented cells. (c–h) Identification of cells that express (for example CD45+CD3+CD4+ or CD8+) or do not express (for example Igκ/Igλ-) a biologically relevant set of markers. (i) Classification of T cells. Red arrows were used throughout (c–i) to track CD8+ T cells. Green arrows were used throughout c–i) to track CD4+ T cells. Cyan arrows were used throughout (c–i) to track CD4+ proliferating T cells.
Figure 7—figure supplement 4. Manual selection of B cells.
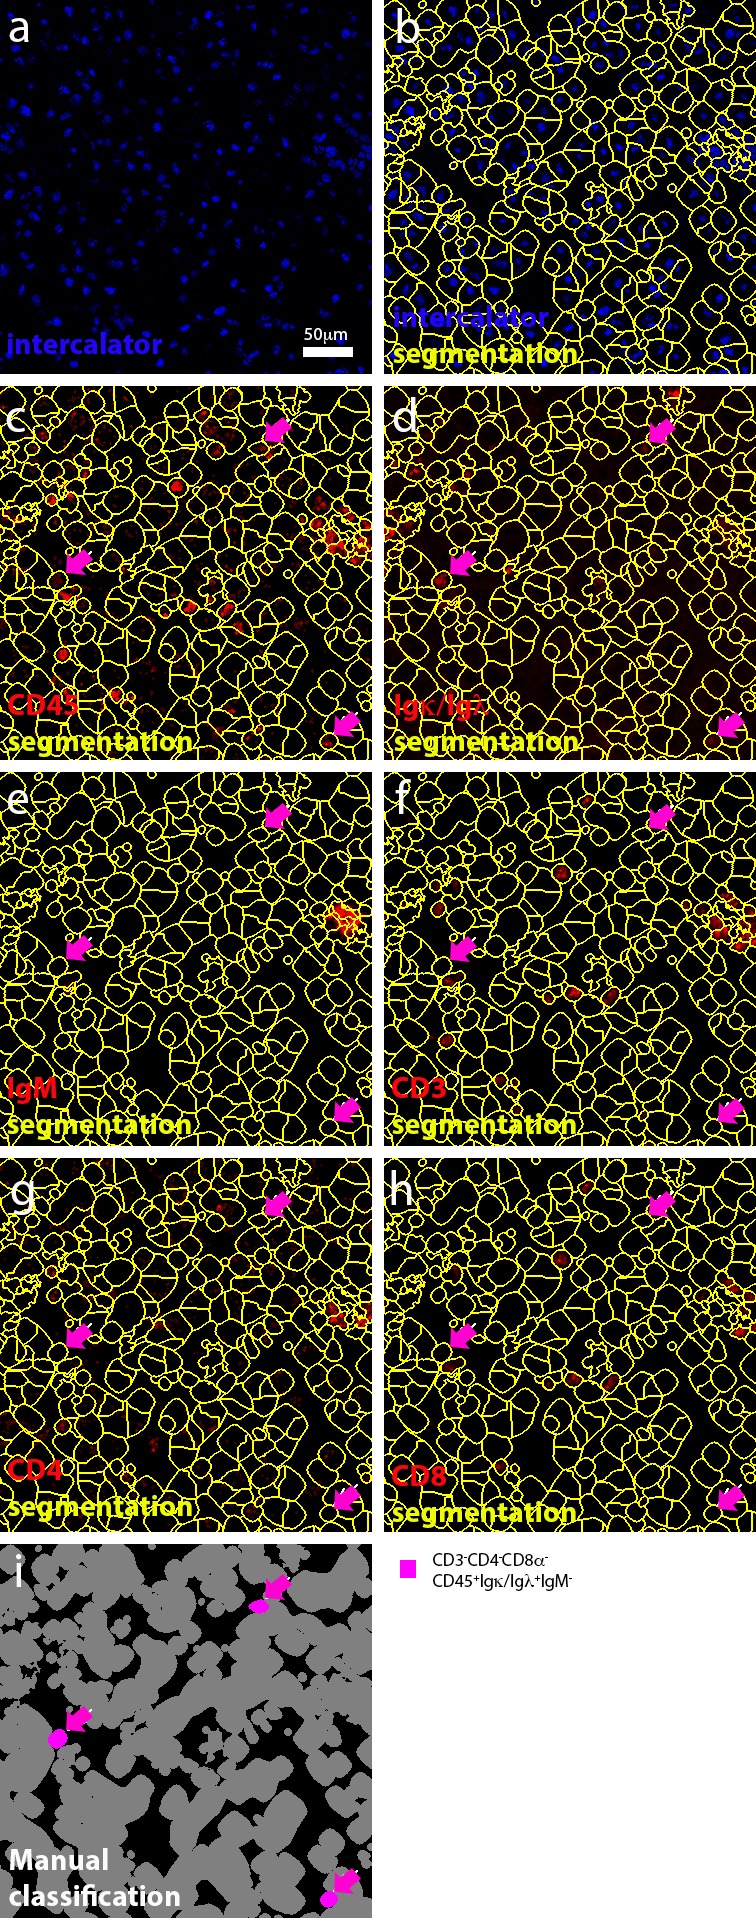
Figure 7—figure supplement 4.

(a) Representation of manually-annotated cells in a mixed active-inactive lesion, based on the detection of nuclei. (b) Segmented cells. (c–h) Identification of cells that express (for example CD45+Igκ/Igλ+) or do not express (for example CD3-CD4-CD8-) a biologically relevant set of markers. (i) Classification of B cells. Magenta arrows were used throughout c–i) to track B cells.
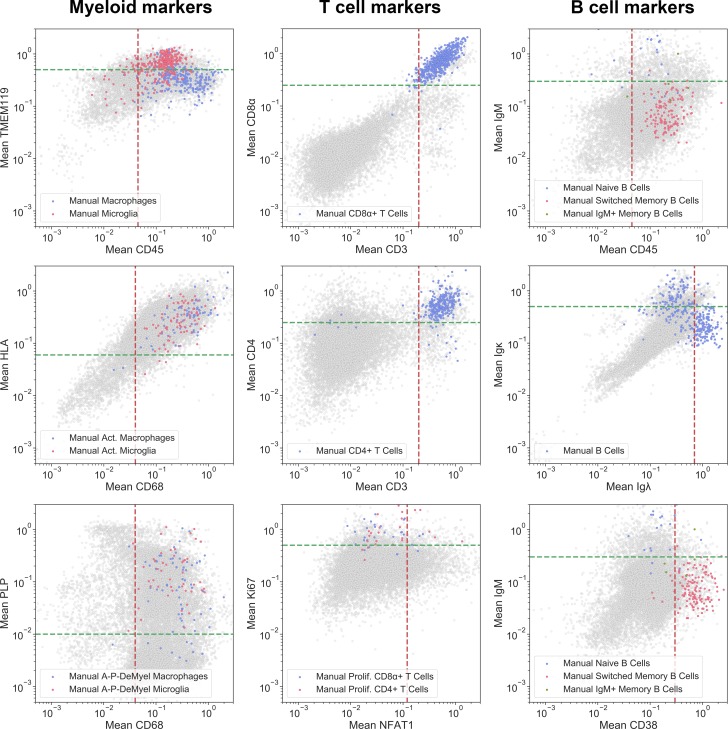
Figure 7—figure supplement 5. Gating strategy used for the identification of cell subsets.

Figure 7—figure supplement 5.

Gating strategy for the identification of cell subset phenotypes and activation states of microglia, macrophages, T cells and B cells. In brief, the per-cell mean intensities of specific marker combinations are shown here in 2D log-log biaxial scatterplots. Gates were established based on pathologist-verified positive cells (see colored cells superimposed into each dotplot contrasting with non-verified cells in gray).
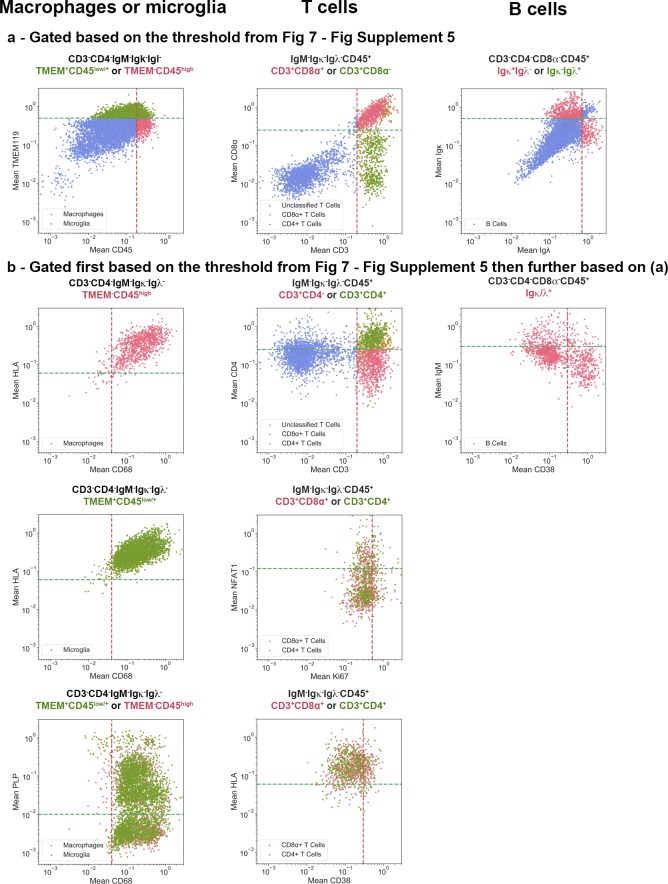
Figure 7—figure supplement 6. Gating strategy used for the generation of heat maps.

Figure 7—figure supplement 6.

Using the quadrants that capture the appropriate positivity range of each cell phenotype shown in Figure 7—figure supplement 5, cells were subjected to the positive and negative gating strategies as outlined in the Materials and methods for each lineage and indicated in (a). Subsequently, these cells were plotted for the marker combinations listed in Table 2. The frequency of cells in each quadrant are indicated. Note that some CD3+CD45+ T cells could not be classified because they fell outside of the specified gates for either of the two markers – CD8+ cells that were not simultaneously CD4-, or CD4+ cells that were not simultaneously CD8-. This is due to the dynamic range of these particular markers and thus our inability to get a clean CD4+CD8- or CD4-CD8+ T cell population. Cells that fulfilled the gating criteria specified above each image, but which did not fulfill the requirements for classification as Macrophages, Microglia, B cells or T cells, are shown in blue.