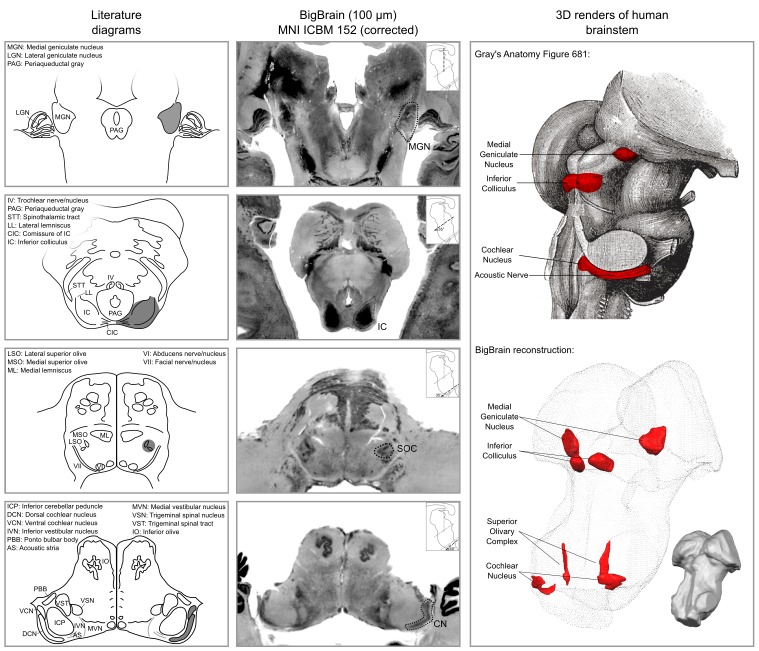
Figure 1. Literature diagrams (left columns) redrawn from Moore (1987) for the cochlear nucleus (CN), superior olivary complex (SOC), inferior colliculus (IC) and from the Allen Human Brain Atlas (Hawrylycz et al., 2012) for the medial geniculate body (MGB) compared to similar cuts from histology (BigBrain) in MNI (central column) and 3-D reconstructions of the segmented structures from the histology (bottom right column).
The auditory structures are highlighted in gray in the left column, by a dotted line in the central column and in red on the modified Gray’s anatomy Plate 719 (Gray and Lewis, 1918) and rendered as solid red surface meshes within the surface point cloud render of BigBrain MNI brainstem (right column). See Figure 9 for 3-D animated videos of these auditory structures.

