. 2019 Aug 1;8:e48932. doi: 10.7554/eLife.48932

Figure 4. Single subject functional activation maps obtained from Experiment one thresholded for significance (FDR-q = 0.05 and p<0.001; see Materials and methods for details) and leave-one-out probabilistic functional maps highlighting voxels that are significant in at least three of the other nine subjects.

For each participant, CN/SOC and IC are shown in transversal cuts, MGB is shown in a coronal cut. See single subject videos for 3-D view of these maps in Figure 10 supplements. Unthresholded maps can be found in our online resources (see Data Availability section).

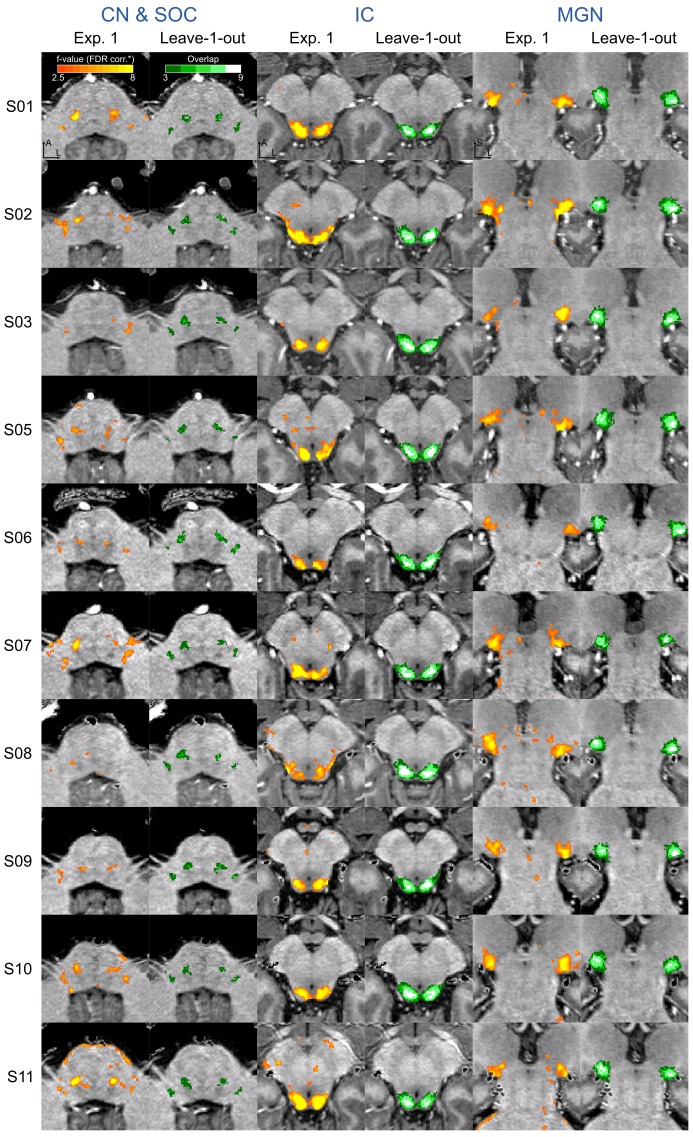
Figure 4.

Figure 4—figure supplement 1. Correspondence between single subject activation maps and leave-one-out probabilistic maps.

Figure 4—figure supplement 1.

Correspondence between single subject activation maps and leave-one-out functional probabilistic maps. Leave-one-out probabilistic functional maps are thresholded to identify voxels that are significantly responding to sounds in at least three of nine participants. The overlap represents (per region of interest) the percentage of the voxels on the leave-one-out probabilistic maps that is significantly responding to sounds in the left out subject. For each region of interest, we also report the distance in mm between the centroids of the leave-one-out probabilistic maps and the centroids of the regions significantly responding to sounds in the left out subject. The last column represents the average overlap and distance across participants per region and error bars represent the standard error across the participants.
Figure 4—figure supplement 2. Effect of threshold on leave-one-out probabilistic maps on correspondence with single subject activations].

Figure 4—figure supplement 2.

Correspondence between single subject activation maps and leave-one-out functional probabilistic maps at different thresholds. Leave-one-out probabilistic functional maps are thresholded to identify voxels that are significantly responding to sounds by varying thresholds from at least one of nine participants to at least six of nine participants. The overlap represents (per region of interest) the percentage of the voxels on the leave-one-out probabilistic maps that is significantly responding to sounds in the left out subject. For each region of interest, we also report the distance in mm between the centroids of the leave-one-out probabilistic maps and the centroids of the regions significantly responding to sounds in the left out subject. Boxplots represent the average overlap and distance across participants per region and error bars represent the standard error across the participants.
Figure 4—figure supplement 3. Reproducibility across experiments of the functional activation maps in six participants (also see Figure 11).

Figure 4—figure supplement 3.

Reproducibility of functional activation maps. Functional activation maps obtained from Experiment one and Experiment 2 (six participants) thresholded for significance (FDR-q = 0.05 and p<0.001; see Materials and methods for details). For each participant, CN/SOC and IC are shown in transversal cuts, MGB is shown in a coronal cut.
Figure 4—figure supplement 4. Correspondence between single subject activation maps across experiments.

Figure 4—figure supplement 4.

Correspondence between single subject activation maps Experiment one and Experiment 2. All maps are thresholded for significance (FDR-q = 0.05 and p<0.001; see Materials and methods for details). The overlap represents (per region of interest) the percentage of the voxels significantly active in Experiment 1 that is significantly responding to sounds in Experiment 2. For each region of interest, we also report the distance in mm between the centroids of the regions significantly responding to sounds in both experiments. Videos are provided in the appendix that visualize thresholded and unthresholded maps for each of the individual participants. The last column represents the average overlap and distance across participants per region and error bars represent the standard error across the participants.
Figure 4—figure supplement 5. Effect of spatial smoothing in the analysis of the data collected from two of the participants.

Figure 4—figure supplement 5.

Effect of spatial smoothing on functional activation maps. Functional activation maps obtained from Experiment one in two participants with and without applying spatial smoothing (1.5 mm FWHM Gaussian smoothing) prior to the statistical analysis. Maps are thresholded for statistical significance (FDR-q = 0.05 and p<0.001; see Materials and methods for details)). For each participant, CN/SOC and IC are shown in transversal cuts, MGB is shown in a coronal cut.