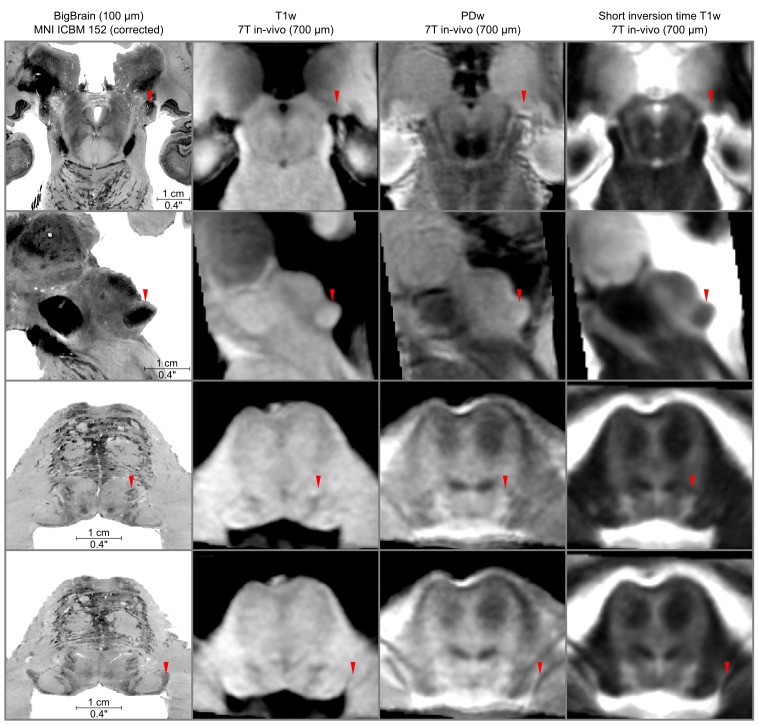
Figure 5. In vivo functional MRI responses to auditory stimuli, combined across 10 participants.
Left column: Conjunction of participants plotted on top of one participant’s short inversion T1-weighted anatomical MRI. Center column: Conjunction of participants’ fMRI responses warped to MNI space and plotted on top of BigBrain MNI (corrected) image. Right column: Conjunction of fMRI responses plotted on top of post mortem MRI vasculature images (1.1 mm minimum intensity projection).


