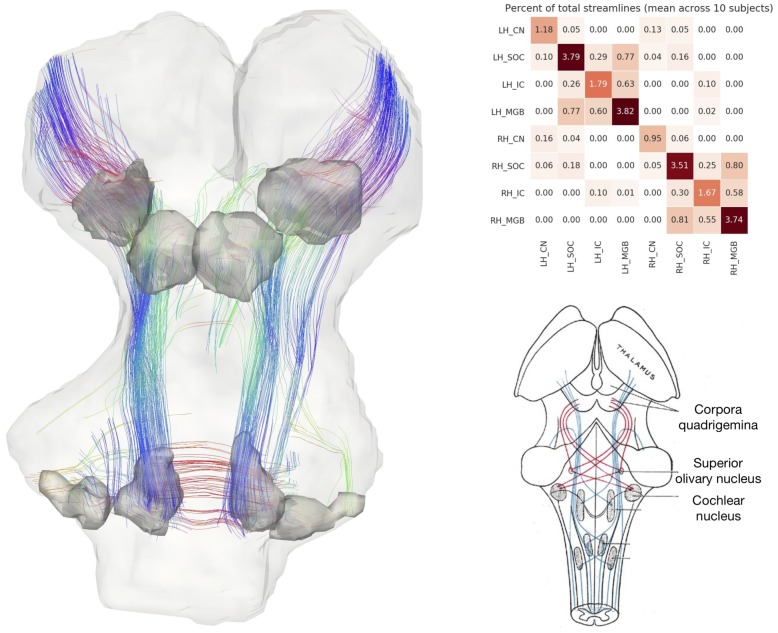
Figure 6. In vivo tractography of the subcortical auditory system from 7T diffusion-weighted MRI.
Left: 3-D images from one participant. Fiber orientation distribution functions were estimated from diffusion-weighted MRI images of the brainstem and were used for deterministic tractography. Streamlines that passed through functionally defined auditory ROIs (dark grey) are shown here (excluding streamlines through the medulla). Colors represent the local orientation at each specific point along the streamline: blue is inferior-superior, red green is anterior-posterior, and red is left-right. A rotating animation is available in the online resources. Top right: connectivity between subcortical auditory ROIs as a percentage of total brainstem streamlines, averaged over 10 participants. Bottom right: schematic of auditory brainstem connectivity from Gray’s Anatomy of the Human Body. A video of the streamlines is available online: https://osf.io/ykd24/.


