. 2019 Aug 23;8:e48660. doi: 10.7554/eLife.48660

Figure 3. Single-cell RNAseq revealing cellular states underlying the cell-cycle entry of reactive RG.

(A) Workflow for single-cell RNA-seq (scRNA-seq) of tectal RG after stab injury. Optic tecta are dissected from 3 dpi Tg(gfap:GFP) zebrafish brain and dissociated into a single-cell suspension. Single GFP+ RG are sorted by fluorescence-activated cell sorting (FACS) and followed by 10x genomics scRNA-seq. (B) A t-SNE plot of 1174 single tectal RG at 3 dpi revealing 5 cell clusters. Dormant RG (dRG, cluster 1) in orange; Reactive RG (rRG, cluster 2) RG in dark cyan; Proliferative-S RG (pRG-S, cluster 3) in Indian red; Proliferative-G2 RG (pRG-G2, cluster 4) in purple; Unidentified RG (cluster 5) in dark green. (C) Heatmap showing the expression of the top 20 marker genes that characterize each cell clusters. Rows represent genes while columns represent cells. (D–I) t-SNE plots showing expression of state-specific genes of distinct cell states. (J) Cell-cycle characteristics of individual cell states. S phase-related genes are mainly expressed in pRG-S cluster (cluster 3), G2/M-related genes are mainly expressed in pRG-G2 cluster (cluster 4). (K) Pseudo-time developmental trajectory of identified states using Monocle showing that the trajectory is booted from dRG cluster (cluster 1) and end at pRG-G2 cluster (cluster 4). (L–N) Violin plots of expression for genes enriched in dRG cluster (mfge8a, cluster 1), rRG cluster (klf6a, cluster 2) and pRG-S/G2 cluster (insm1a, cluster 3 and 4). (O–T1) In situ hybridization showing the expression of mfge8a (O–P1), klf6a (Q–R1) and insm1a (Q–R1) in the optic tecta after injury. The white arrowheads shown in (O and O1) indicate PCNA+ proliferative RG are mfge8a, the open white arrowheads indicate klf6a (Q and Q1) or insm1a (S and T1) mRNA signals are located in processes of proliferative RG. White dashed lines represent the tectal ventricle boundary. t-SNE, t-stochastic neighbor embedding; RG, radial glia; PGZ, periventricular gray zone, TS, torus semicircularis. Scale bars, 30 μm. See also Figure 3—figure supplements 1 and 2 and Materials and methods.

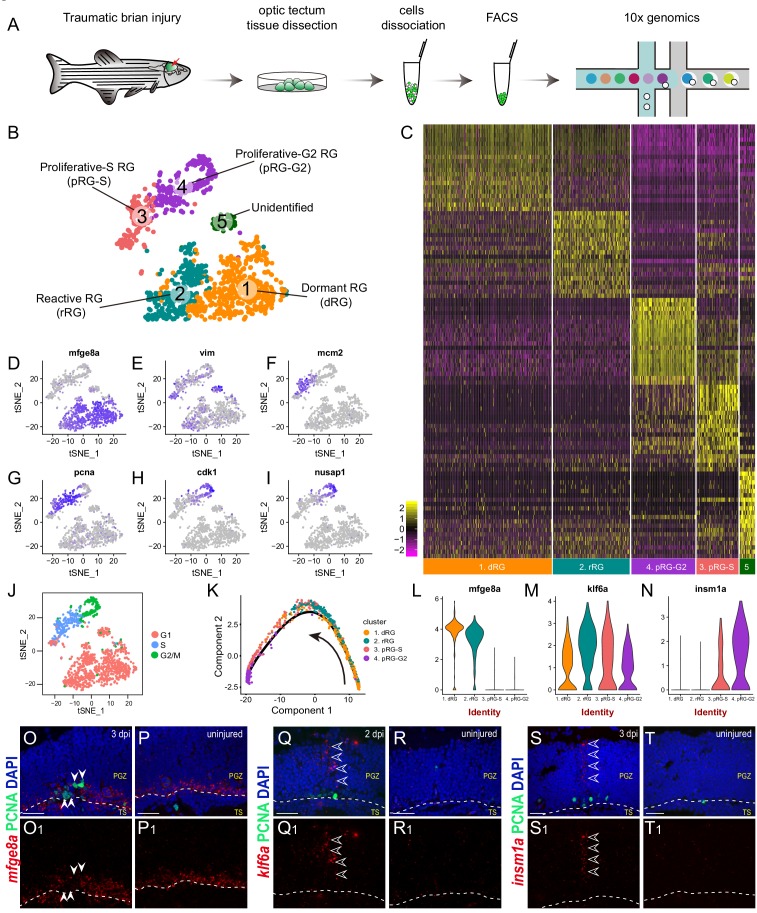
Figure 3.

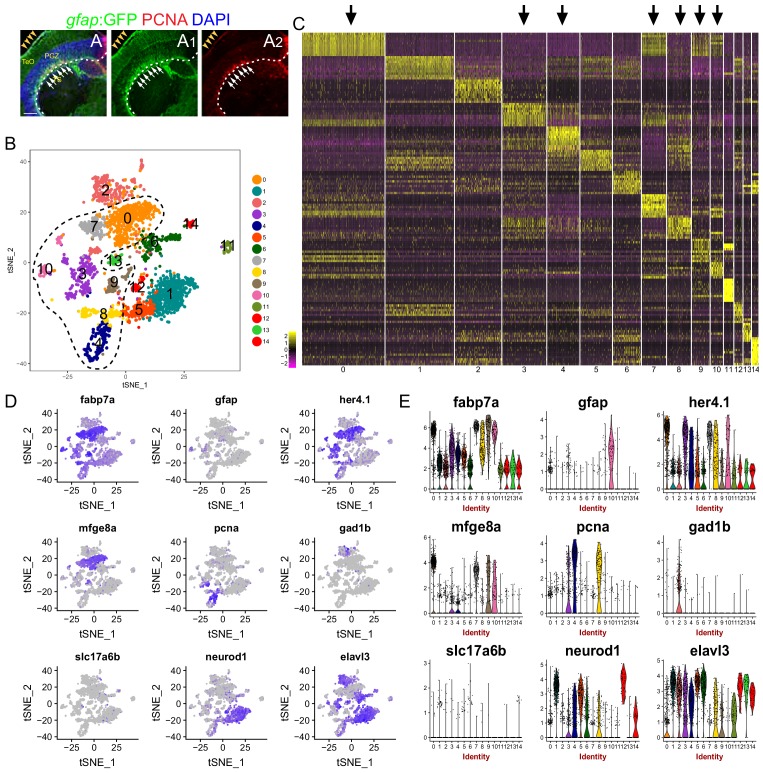
Figure 3—figure supplement 1. Glial and Non-glial cell clusters identification from the scRNA-seq data.

Figure 3—figure supplement 1.

(A–A2) Tg(gfap:GFP) (green) and PCNA (red) immunofluorescences show large-area injury induces many RG (GFP+/PCNA+ yellow cells, white arrows) to proliferate at 3 dpi. White dashed lines represent the optic tectum boundary. Yellows arrow heads indicate the injury sites. (B) t-SNE plot of 2298 single cells at 3 dpi revealing 15 cell clusters. Black dashed line indicates picked glial cell clusters (cluster 0, 3, 4, 7, 8, 9, 10). (C) Heatmap showing the expression of top 20 marker genes that characterize each cell clusters. Rows represent genes while columns represent cells. Black arrows indicate the picked glial cell clusters (cluster 0, 3, 4, 7, 8, 9, 10). (D) t-SNE plots showing expression of 9 genes utilized to identify neuronal clusters and glial clusters. (E) Violin plots of expression of 9 genes shown in (D). RG, radial glia; TeO, tectal opticum; PGZ, periventricular gray zone; TS, torus semicircularis. Scale bar, 100 μm.
Figure 3—figure supplement 2. Identification of the clusters representing RG in the TPZ and oligodendrocytes.

Figure 3—figure supplement 2.

(A) t-SNE plot of 1604 glial cells revealing 11 cell clusters. (B) t-SNE plots showing the expression pattern of 6 genes utilized to identify the cluster consists of RG from TPZ (cluster 1) and oligodendrocytes (cluster 10). (C) Violin plots of expression of 6 genes shown in (B). (D–F) In situ hybridization showing her4 mRNA is highly expressed in RG from TPZ (open white arrows in (D)) and dormant RG (open white arrowheads in (E and F)) in central-dorsal region of optic tectum, whereas its expression is down-regulated in RG underneath the injury site ((F), white arrow). White dashed lines represent the tectal ventricle boundary. (G–I1) Representative images of Tg(gfap:GFP) (green), Vimentin (red) and PCNA (white) immunofluorescences showing the RG in the neighboring brain tissues (yellow dashed lines in H-I1) under the PGZ in the midbrain are GFP+/Vimentin+/PCNA. These cells are likely to cause contamination (cluster 5 in Figure 3B) during the dissection of the optic tecta. (J) Pseudo-time developmental trajectory of identified states using Slingshot showing that the trajectory is booted from dRG cluster (cluster 1) and end at pRG-G2 cluster (cluster 4). RG, radial glia; TeO, tectal opticum; PGZ, periventricular gray zone; TS, torus semicircularis; Val, valvula cerebelli. Scale bars, 50 μm.