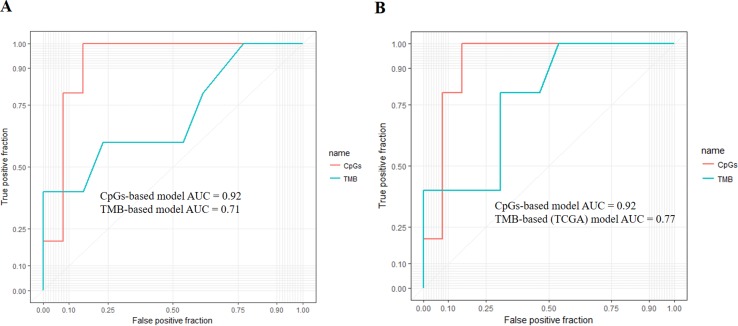
Figure 3.
(A) Performance comparison of the CpG-based model and tumor mutational burden (TMB)-based model. The area under the receiver operating characteristic curve (AUC) scores of the CpG-based model and TMB-based model were 0.92 and 0.71, respectively, which indicated that our model had better performance. (B) Performance comparison of the CpG-based model and TMB-based model using The Cancer Genome Atlas (TCGA) samples. The AUC scores of the CpG-based model and TMB (TCGA)-based model were 0.92 and 0.77, respectively, which indicated that our model had better performance.

