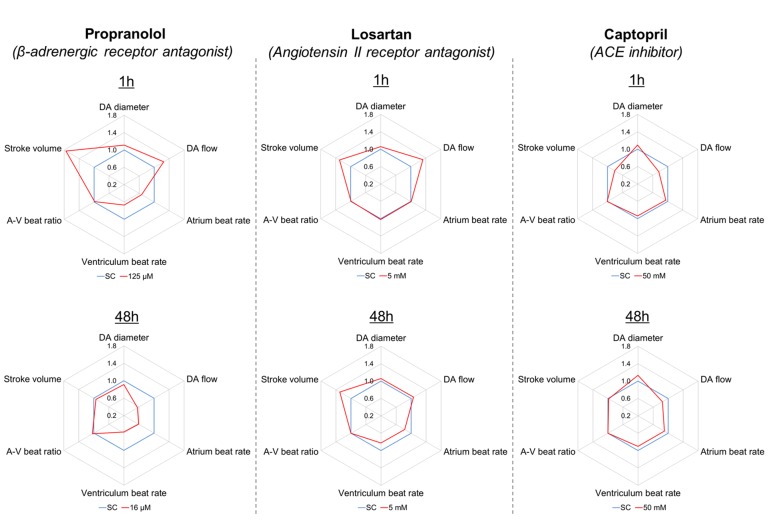
Figure 2.
Integrated representation of the effects induced by propranolol (125 µM), losartan (5 mM), and captopril (50 mM) on six cardiovascular endpoints measured in zebrafish larvae (7 dpf), after 1 and 48 h exposure. Each graph represents the effect size observed for each endpoint in treated fish (red) versus control fish (blue), expressed as ratio between mean treated value and mean control value. For example, a treated value of 1.1 indicates a 10% increase versus the control value.

