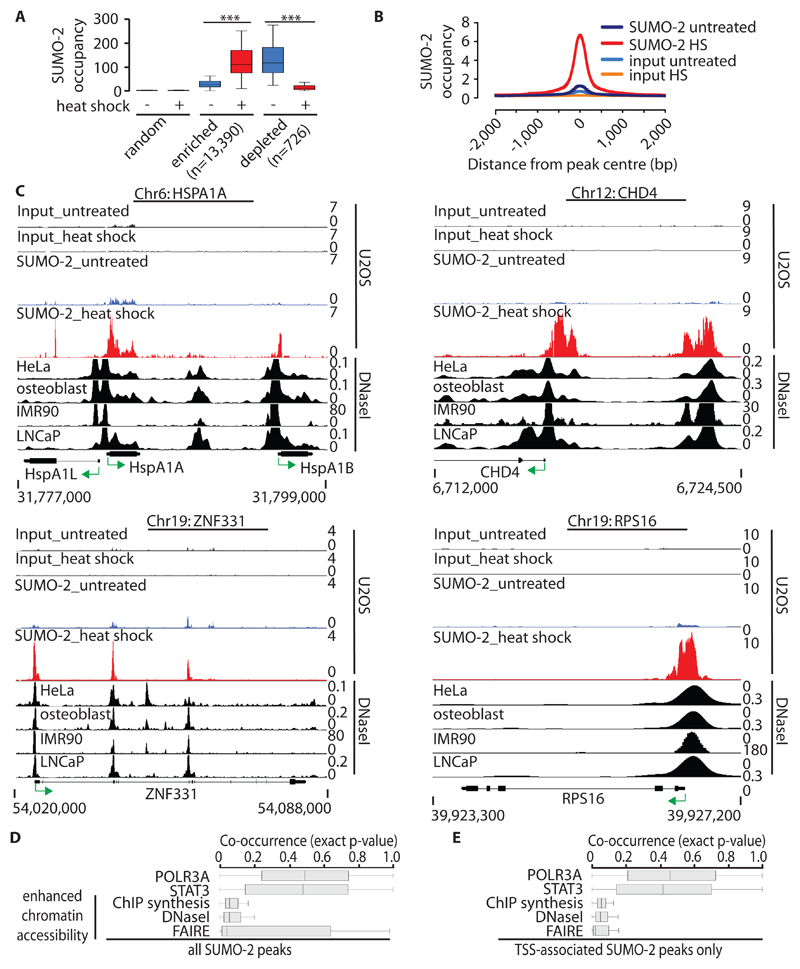
Fig. 1. Genome-wide analysis of SUMO-2 chromatin occupancy during HS.
(A) SUMO-2 occupancy at enriched, depleted, and control sites in untreated U2OS cells and in U2OS cells subjected to HS (dataset 2). The y-axis represents RPKM (reads per kb per million mapped reads). Boxplots (64) are shown without outliers. ***P ≤ 10-16 by pairwise Wilcoxon signed-rank test. (B) Profile of HS-induced SUMO-2 peaks (dataset 2). Alignment of sequencing reads at 13,390 HS-induced SUMO-2–binding sites. The y-axis represents reads per base per million reads. (C) Alignment of HS-induced SUMO-2–binding sites associated with HSPA1A, CHD4, RPS16, and ZNF331 in U2OS cells with DHSs from untreated HeLa-S3 cells, osteoblasts, IMR90 cells, and LNCaP cells (from ENCODE). Green arrows indicate the direction of transcription. Chr, chromosome. (D) Co-occurrence of HS-induced SUMO-2 peaks (n = 13390) and sites of enhanced chromatin accessibility (from ENCODE) 5 kb either side of the SUMO-2 peaks calculated by IntervalStats. POLR3A and STAT3 (from ENCODE) are shown as negative controls. Enhanced chromatin accessibility datasets are derived from untreated HeLa-S3 cells. FAIRE, formaldehyde-assisted isolation of regulatory elements; DNaseI, DNaseI-seq; ChIP synthesis, compilation of transcription factor–binding sites identified by ChIP-seq experiments for various transcription factors. (E) Co-occurrence of HS-induced TSS-associated SUMO-2 peaks only (n = 7325 peaks; TSS ± 2 kb). Details are as described for (D).

