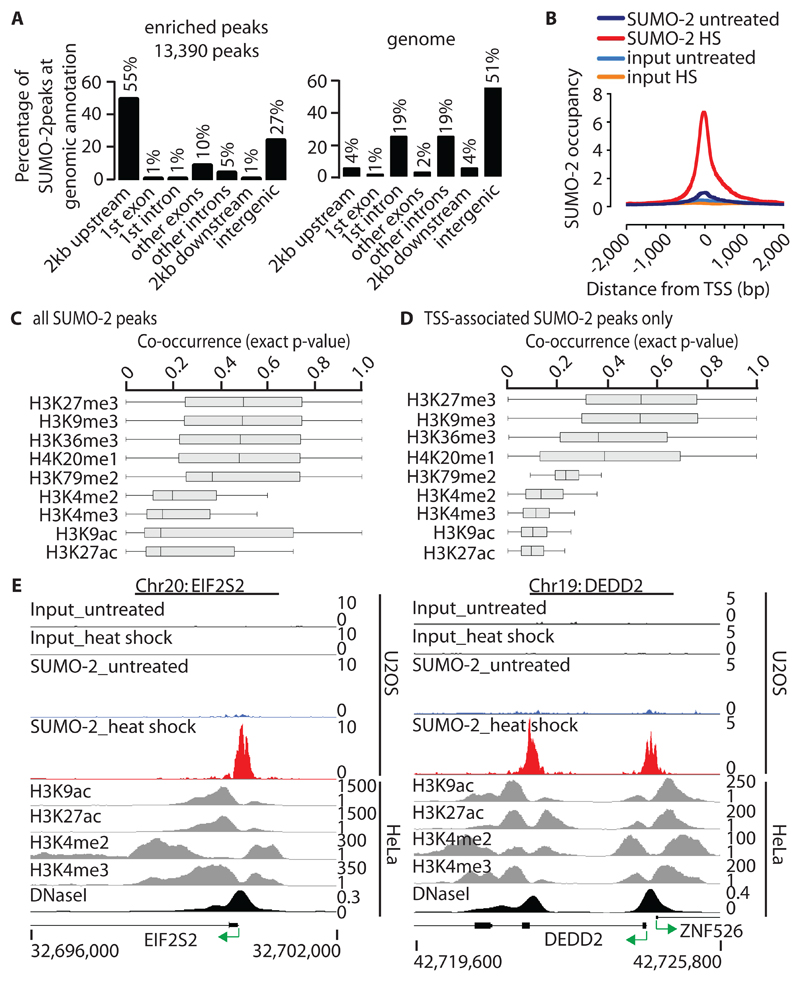
Fig. 2. Genomic distribution of HS-induced SUMO-2 peaks and their relationship to active histone marks.
(A) Left: Location of HS-induced SUMO-2–binding sites relative to the annotated protein-coding genome, including 2 kb upstream from the TSS, 2 kb downstream from the end of the gene, and intergenic sites (> 2 kb from any gene). Right: The distribution of annotations across the human genome is shown for comparison. (B) Alignment of HS-induced SUMO-2 peaks to the TSSs of protein-coding genes (dataset 2). A total of 7325 HS-induced SUMO-2 peaks map to a region spanning 2 kb either side of TSSs (n = 6290 peaks). The y-axis represents reads per base per million reads. (C) Co-occurrence of HS-induced SUMO-2 peaks (n = 13390) and histone modification marks within a region spanning 5 kb either side of a SUMO-2 peak as calculated by IntervalStats. Histone modification data sets are derived from untreated HeLa-S3 cells. (D) Co-occurrence of HS-induced TSS-associated SUMO-2 peaks only (n = 7325 peaks; TSS ± 2 kb). Details are as described for (C). (E) Alignment of HS-induced SUMO-2 peaks with active histone modification marks at sites associated with EIF2S2 (left) and DEDD2 (right). See (C) for histone datasets.

