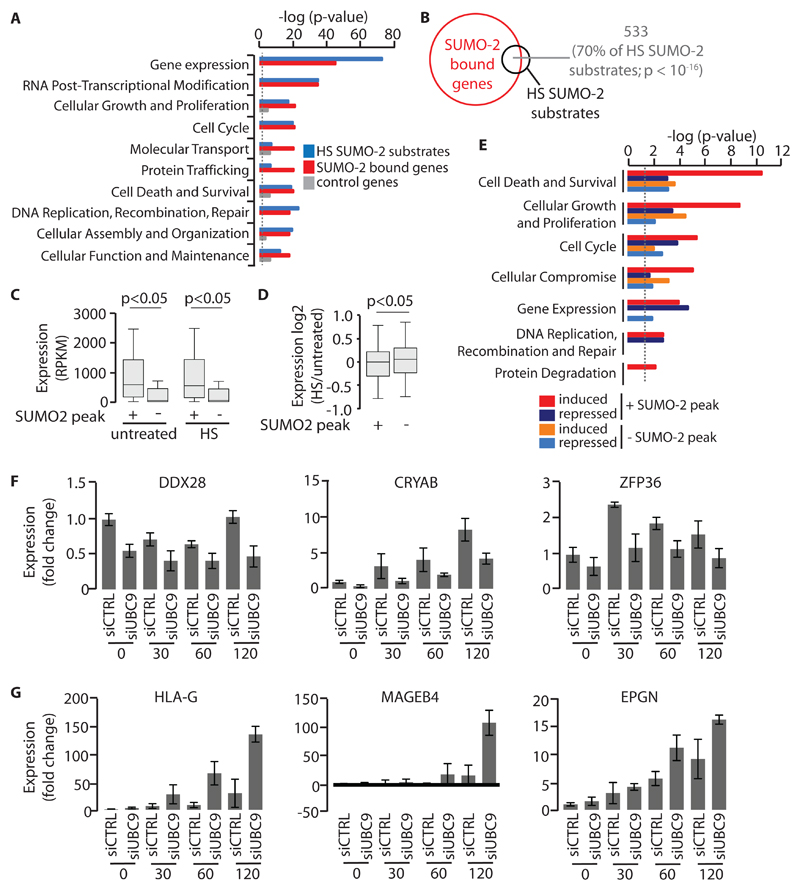
Fig. 3. Relationship between HS-induced SUMO-2 occupancy and gene expression.
(A) Functional analysis of HS TAP-SUMO-2 substrates (n = 755 HS TAP-SUMO-2 substrates) (17) and genes associated with HS SUMO-2 peaks (n = 8036 genes associated with HS SUMO-2 peaks). A random gene set (n = 2500 genes) not associated with HS-induced SUMO-2 peaks served as a control. The dotted line indicates P = 0.05. (B) Venn diagram showing overlap between HS TAP-SUMO-2 substrates (n = 755 HS TAP-SUMO-2 substrates) and SUMO-2–bound genes (n = 8036). (C) The relative abundances of mRNAs of genes that were either bound or not bound by SUMO-2 in untreated U2OS cells or in U2OS cells subjected to HS for 4 hours were measured by RNA-seq. Boxplots and P values were derived as described in Fig. 1A. Data are from three biological replicates. (D) Differential expression analysis of SUMO-2 target genes and non-SUMO-2 target genes in response to HS. Boxplots and P values were derived as described in Fig. 1A. Data are from three biological replicates. (E) Molecular and cellular function analysis of SUMO-2 target genes and non-SUMO-2 target genes upon HS. Dotted line denotes P = 0.05. (F) Effect of the siRNA-mediated depletion of Ubc9 on SUMO-2 target gene expression after HS. Cells were transfected with control siRNA or Ubc9-specific siRNA. Ninety-six hours later, cells were left untreated or were subjected to HS for the indicated times before newly synthesized RNAs were labeled with 4-thiouridine and the indicated RNAs were quantified. (G) Effect of the siRNA-mediated depletion of Ubc9 on non-SUMO-2 target gene expression after HS. Cells were transfected with control siRNA or Ubc9-specific siRNA. Ninety-six hours later, cells were left untreated or were subjected to HS for the indicated times before newly synthesized RNAs were labeled with 4-thiouridine and the indicated RNAs were quantified. Data in (F) and (G) are means ± SEM of three independent biological replicates.

