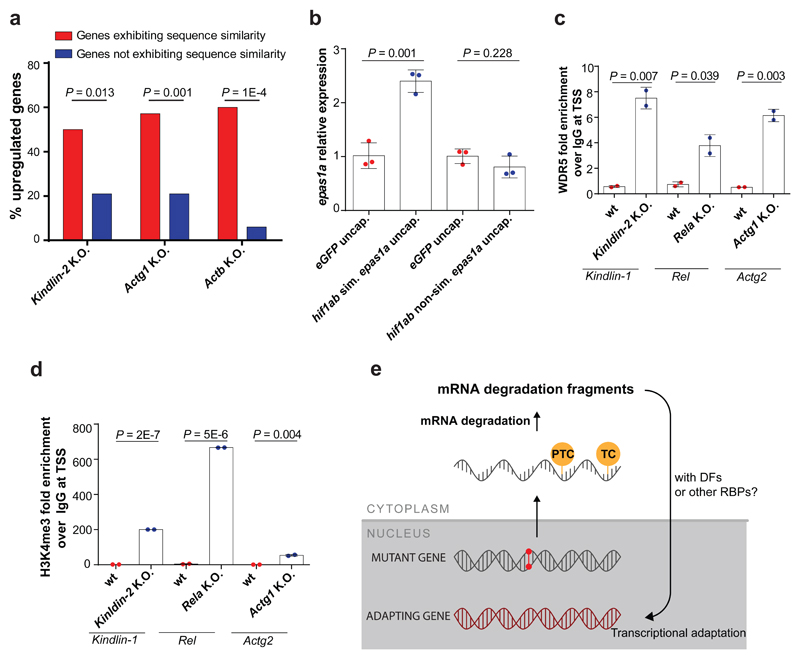
Figure 4. Transcriptional adaptation favors genes exhibiting sequence similarity to the mutated gene’s mRNA and is associated with permissive histone marks.
a, Percentage of significantly upregulated (Log2 Fold Change K.O. > wt and P ≤ 0.05) protein-coding genes exhibiting sequence similarity with Fermt-2, Actg1 or Actb and those not exhibiting sequence similarity. b, qPCR analysis of epas1a mRNA levels in 6 hpf wt zebrafish injected with uncapped RNA composed solely of the hif1ab mRNA sequences similar to epas1a or uncapped RNA composed solely of the hif1ab mRNA sequences not similar to epas1a. c, d, ChIP-qPCR analysis of Wdr5 (c) and H3K4me3 (d) occupancy near the TSS of Fermt1, Rel and Actg2 in Fermt-2, Rela and Actg1 K.O. cells, respectively, compared to wt. Quantification of enrichment shown as fold-enrichment over IgG control. e, Current putative simplified model of transcriptional adaptation to mutations. TC: termination codon; DFs: decay factors; RBPs: RNA binding proteins. b, Control expression set at 1. b-d, n = 3 (b); 2 (c, d); biologically independent samples. Error bars, mean, s.d. Two-tailed student’s t-test used to assess P values.

