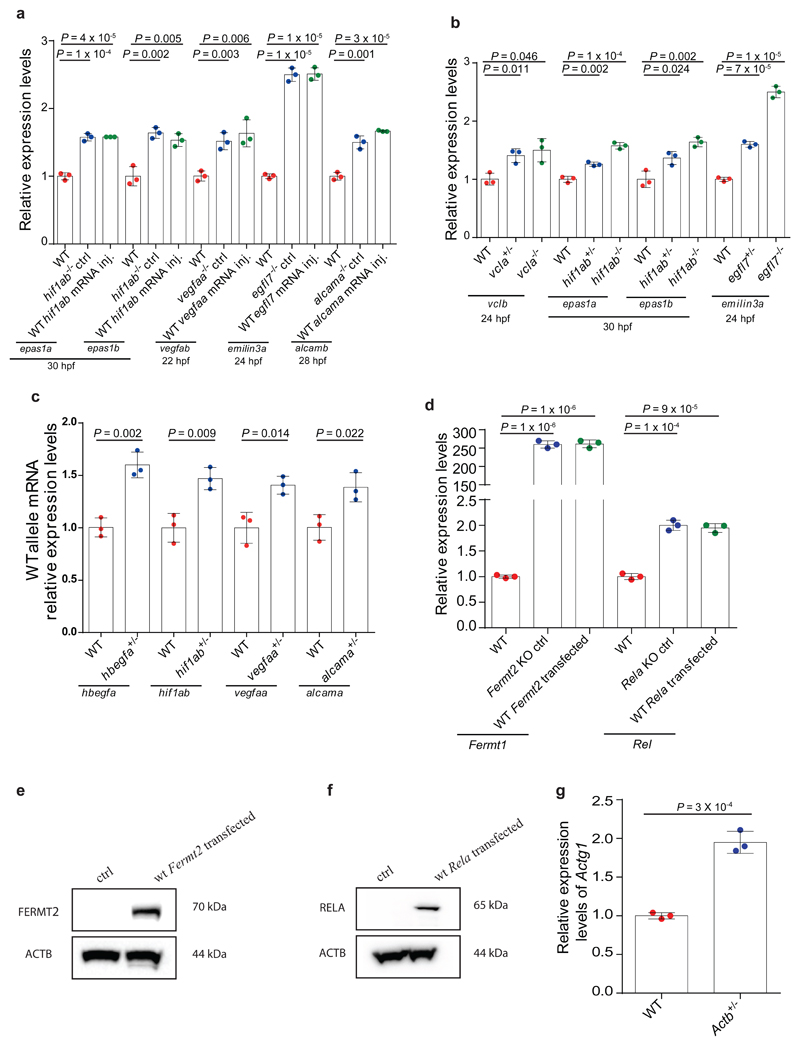
Extended Data Figure 2. Transcriptional adaptation is independent of the loss of protein function.
a, qPCR analysis of epas1a and epas1b, vegfab, emilin3a and alcamb mRNA levels in wt and hif1ab, vegfaa, egfl7 and alcama mutant embryos injected with eGFP mRNA (control) or wt hif1ab, vegfaa, egfl7 or alcama mRNA. b, qPCR analysis of vclb, epas1a and epas1b and emilin3a mRNA levels in vcla, hif1ab and egfl7 wt, heterozygous and mutant zebrafish. c, qPCR analysis of hbegfa, hif1ab, vegfaa and alcama mRNA levels in hbegfa, hif1ab, vegfaa and alcama wt and heterozygous zebrafish using primers specific for the wt allele. d, qPCR analysis of Fermt1 and Rel mRNA levels in wt and Fermt2 and Rela K.O. cells transfected with empty vectors (control) or plasmids encoding wt Fermt2 or RELA. e, Western blot analysis of Fermt2 and ACTB levels in Fermt2 K.O. cells transfected with empty vectors (control) or plasmids encoding wt Fermt2. f, Western blot analysis of RELA and ACTB levels in Rela K.O. cells transfected with empty vectors (control) or plasmids encoding wt RELA. g, qPCR analysis of Actg1 mRNA levels in wt and heterozygous Actb mESCs. a-d, g, n = 3 biologically independent samples. wt or control expression set at 1 for each assay. Error bars, mean, s.d. Two-tailed student’s t-test used to assess P values. e, f, These experiments were repeated twice independently with similar results. For western blots’ source data, see Supplementary Figure 1.

