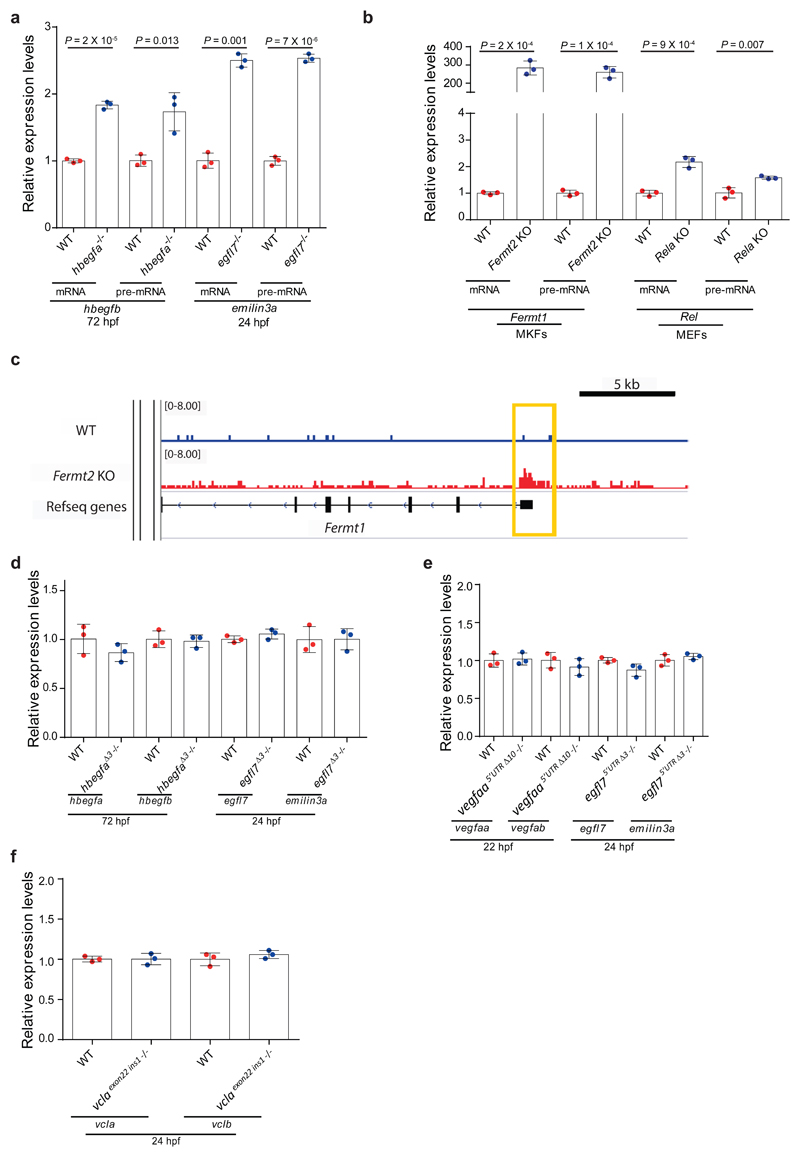
Extended Data Figure 3. Transcriptional adaptation involves enhanced transcription and is independent of the DNA lesion itself.
a, qPCR analysis of hbegfb and emilin3a mRNA and pre-mRNA levels in hbegfa and egfl7 wt and mutant zebrafish. b, qPCR analysis of Fermt1 and Rel mRNA and pre-mRNA levels in Fermt2 and Rela wt and K.O. cells. c, Integrated genome viewer tracks of Fermt1 (Fermt1) locus showing ATAC-seq signals in wt and Fermt2 K.O. cells. d, qPCR analysis of hbegfa, hbegfb and egfl7, emilin3a mRNA levels in hbegfa and egfl7 wt and Δ3 mutant zebrafish. e, qPCR analysis of vegfaa, vegfab and egfl7, emilin3a mRNA levels in vegfaa and egfl7 wt and 5’UTR mutant zebrafish. f, qPCR analysis of vcla and vclb mRNA levels in vcla wt and last exon (exon 22) mutant zebrafish. a, b, d-f, n = 3 biologically independent samples. wt expression set at 1 for each assay. Error bars, mean, s.d. Two-tailed student’s t-test used to assess P values.

