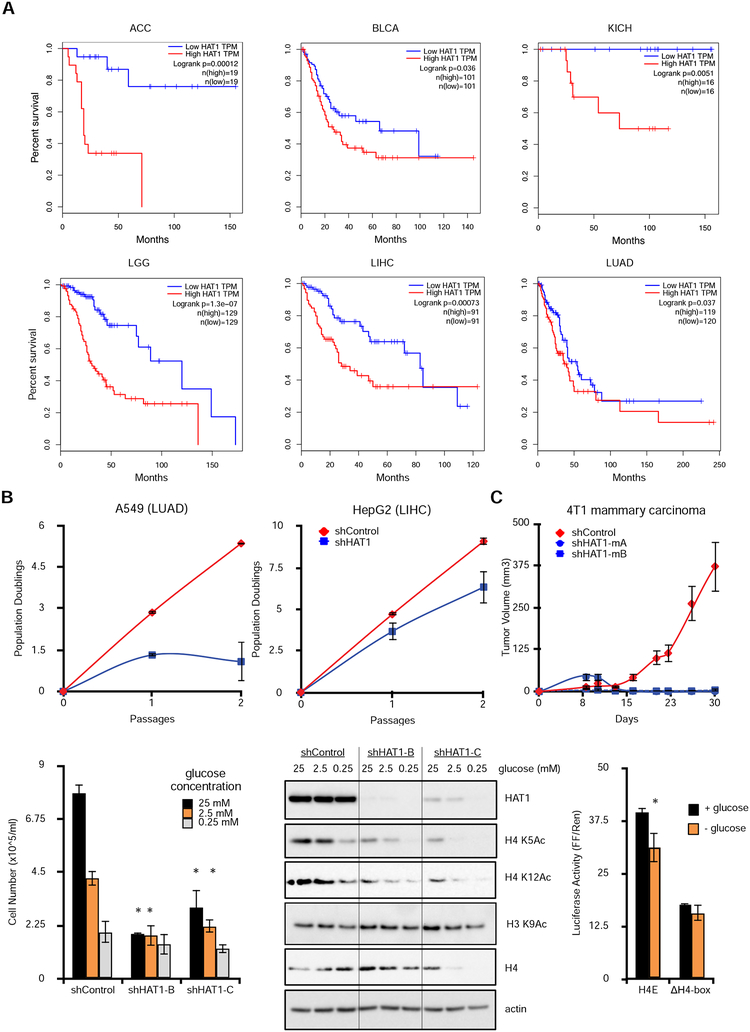
Figure 6: Elevated HAT1 levels are associated with poor patient outcomes in human cancer and maintain H4 acetylation during glucose stimulation.
A. Kaplan-Meier survival plots stratified by HAT1 expression levels (low = lowest quartile by z- score; high = highest quartile). Logrank p-values and total n in each group are indicated. TPM = transcripts per million (RNA-seq quantification). ACC=adrenocortical carcinoma; BLCA=bladder urothelial carcinoma; KICH=kidney chromophobe; LGG=brain lower grade glioma; LIHC=liver hepatocellular carcinoma; LUAD=lung adenocarcinoma.
B. Cancer cell lines A549 (left) and HepG2 (right) were treated with control or HAT1-targeted lentiviral shRNAs and population doublings were measured.
C. 4T1 mammary carcinoma cells expressing the indicated lentiviral shRNAs were orthotopically injected into bilateral mammary fat pads and tumor sizes were measured. n=5 mice in each group, each mouse bearing two tumors. Data are representative of two independent experiments, mean +/− SD is plotted.
D. Stable hTert-HME1 cell lines with controls or HAT1-targeted shRNAs were grown in media containing the indicated glucose concentrations and cells were counted after three days. n=3 biological replicates. * p < 0.05 compared to equimolar shControl condition.
E. Stable hTert-HME1 cell lines were grown in media with the indicated glucose concentrations for three days, then protein was fractionated by SDS-PAGE and immunoblotted. See also Figure S6A.
F. 293T cells were transfected with Firefly luciferase constructs containing either the HIST1H4E (H4E) promoter or the same promoter with the H4-box deleted (H4-box) in glucose containing (25 mM) or glucose-free (0 mM) media. Control renilla luciferase constructs were co- transfected and luciferase activity was measured 24 hours later. See also Figure S6B.

