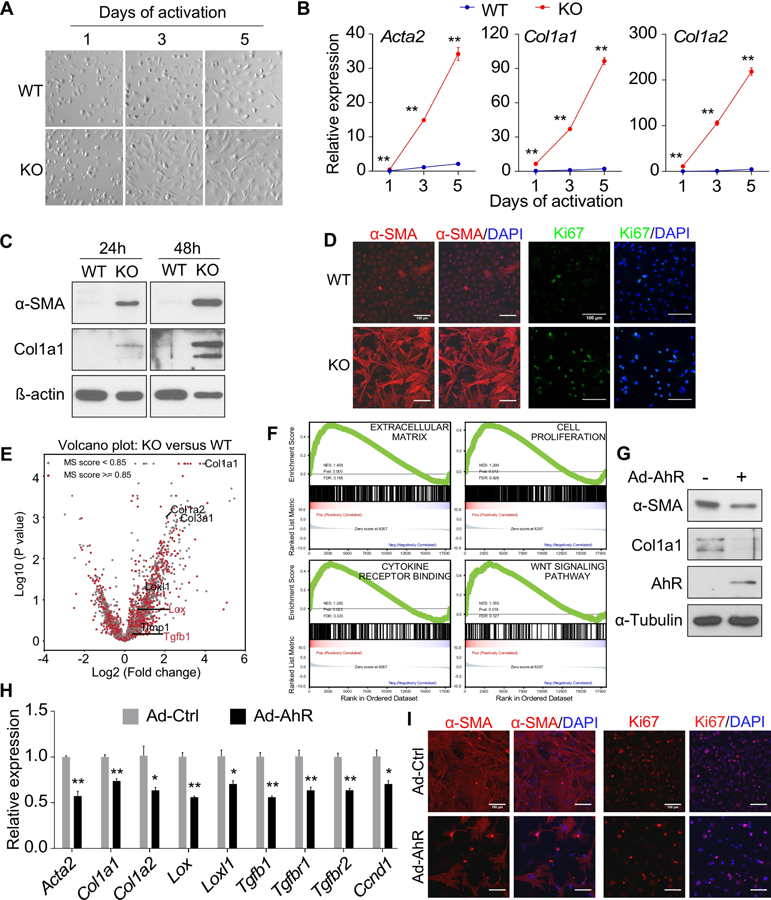
Figure 4. Knockout of AhR promotes HSC activation in vitro.

(A and B) Primary mouse HSCs were isolated from WT and AhR−/− (KO) mice and culture-activated for the indicated duration. Cell morphology was analyzed by light field microscopy (A) and gene expression was determined by real-time PCR (B, n=4). (C) Primary mouse HSCs were isolated and culture-activated for 24h or 48h. The protein expression was determined by Western blotting. (D) Primary mouse HSCs were isolated and culture-activated for 48h. The expression of α-SMA and Ki67 was detected by immunofluorescence. (E) Primary mouse HSCs were isolated and FACS purified and directly subject to RNA-seq analysis. Differentially expressed genes are shown by a volcano plot with several fibrogenic marker genes annotated. The red dots and blue dots indicate genes that are significantly up-regulated (663 genes) and down-regulated (66 genes), respectively. The cutoff was set as 0.05 for p-value and 1.5 for log2(FC) (FC: fold change, KO versus WT). (F) Gene set enrichment analysis (GSEA) of the RNA-seq results. (G-I) Primary mouse HSCs isolated from KO mice were infected with adenovirus overexpressing AhR and treated with or without TCDD (50 nM). The gene expression was determined by Western blotting (G), real-time PCR (H, n=4), or immunofluorescence (I). Scale bar=100 µm. All data were presented as mean ± SEM. *, p<0.05; **, p<0.01.
