Figure 2:
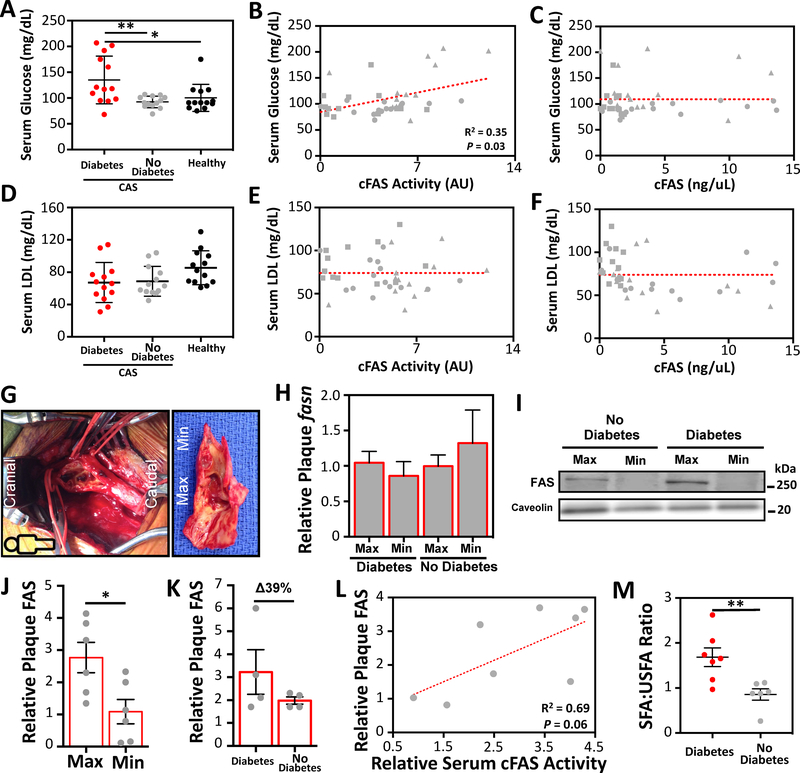
Serum cFAS correlates with serum glucose and carotid plaque FAS and saturated fatty acid content.
(A) Serum cFAS activity and content were evaluated in patients with diabetes and CAS (n=13), patients with no diabetes and CAS (n=13), and controls with no diabetes and no CAS (n=13). Patients with diabetes and CAS have significantly higher serum glucose compared to patients with no diabetes and CAS. *p<0.05, Kruskal-Wallis. Error bars represent the SEM. cFAS activity (B) but not content (C) has a significant correlation with serum glucose (patient with diabetes and CAS, triangle; patient with no diabetes and CAS, square; patient control with no CAS, circle). r2, Spearman correlation. (D) No significant difference was observed in serum LDL between patients with and without diabetes, and control patients. (E and F) No correlation was observed between cFAS activity/content and LDL. (G) Open exposure of the right carotid artery bifurcation with the head towards the left (cranial) and the feet towards the right (caudal). Visible within the clamped carotid bifurcation is irregular ulcerated plaque. Extracted CEA plaque demonstrates a minimally (Min) diseased portion at the distal edge, and a maximally (Max) diseased portion at the carotid bifurcation region. (H) fasn RNA transcript between Max and Min diseased CEA portions was evaluated using RT-PCR. No differences were observed in fasn and between patients with and without diabetes. (I) FAS protein content in CEA plaque homogenates were evaluated by Western blot analysis. (J) Higher levels of FAS were observed in Max diseased plaque compared to Min diseased plaque (n=6 patients). *p<0.05, Mann-Whitney U test. Error bars represent the SEM. (K) FAS protein content in CEA plaque homogenates was evaluated using ELISA. Compared to patients with no diabetes, there was a 39% increase in FAS in the Max and Min CEA plaques of patients with diabetes. Error bars represent the SEM. (L) FAS protein content in CEA plaque demonstrated a moderate correlation with serum cFAS activity, but this difference was not statistically significant. r2, Spearman correlation; p=0.06. (M) The ratio of the relative content of total saturated fatty acid (SFA) to total unsaturated fatty acid (USFA) was significantly higher in the Max CEA plaques of patients with diabetes. **p<0.001, Kruskal-Wallis. Error bars represent the SEM.

