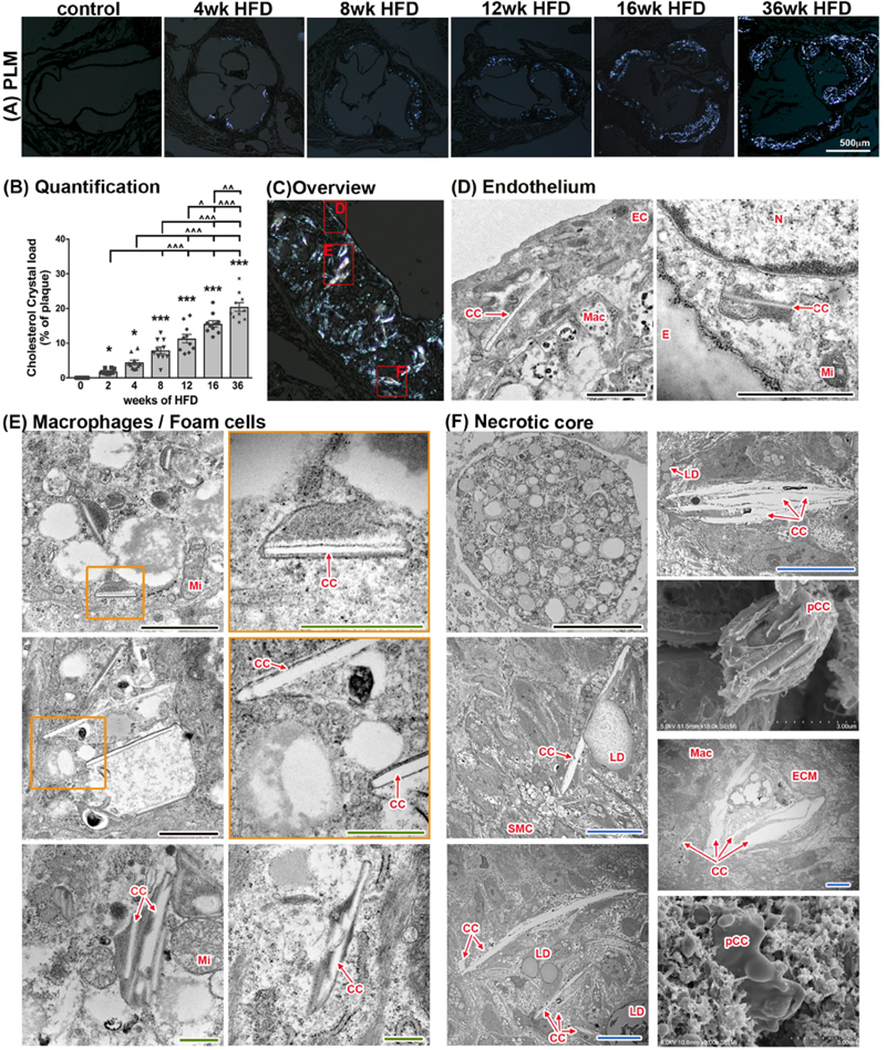
Fig. 4:
CC in atherosclerotic plaques of Ldlr−/− mice at various time points.
(A) Imaging of aortic root sections using polarized light microscopy allows (with subsequent ImageJ quantification) (B) the determination of cholesterol crystal content per plaque area. (n=10 for each time point; ANOVA statistical test, error bar indicates SEM, significance at p<0.05, *significance to 0-week HFD, ^significance between indicated groups; BF - bright field, PL - polarized light) (C) Display of representative areas of atherosclerotic plaques (red squares) visualized by SEM or TEM at various stages of HFD being fed to Ldlr−/− mice. (D) Presence of CC in the endothelial layer can be seen as early as 1 week of HFD. CC within EC can be detected at every stage of atherogenesis. (E) Macrophages with varying degrees of lipid content and CC deposition can be seen in plaques after 2 weeks of HFD. (F) A necrotic core is formed at 8 weeks of HFD and continues to expand with longer duration of HFD. CC are present within the necrotic core. Lipid droplets are located in close proximity to CC and stacking of CC can be seen as well. CC within the necrotic core can reach sizes of 25 μm. CC, cholesterol crystal, E, internal elastic membrane, ECM, extracellular matrix; Mac, macrophage/foam cell; Mi, mitochondria; pCC, possible CC. Orange inserts indicate area of magnification to their right in orange box. Scale bars: black=2.5 μm, blue=10 μm, green=0.5 μm

