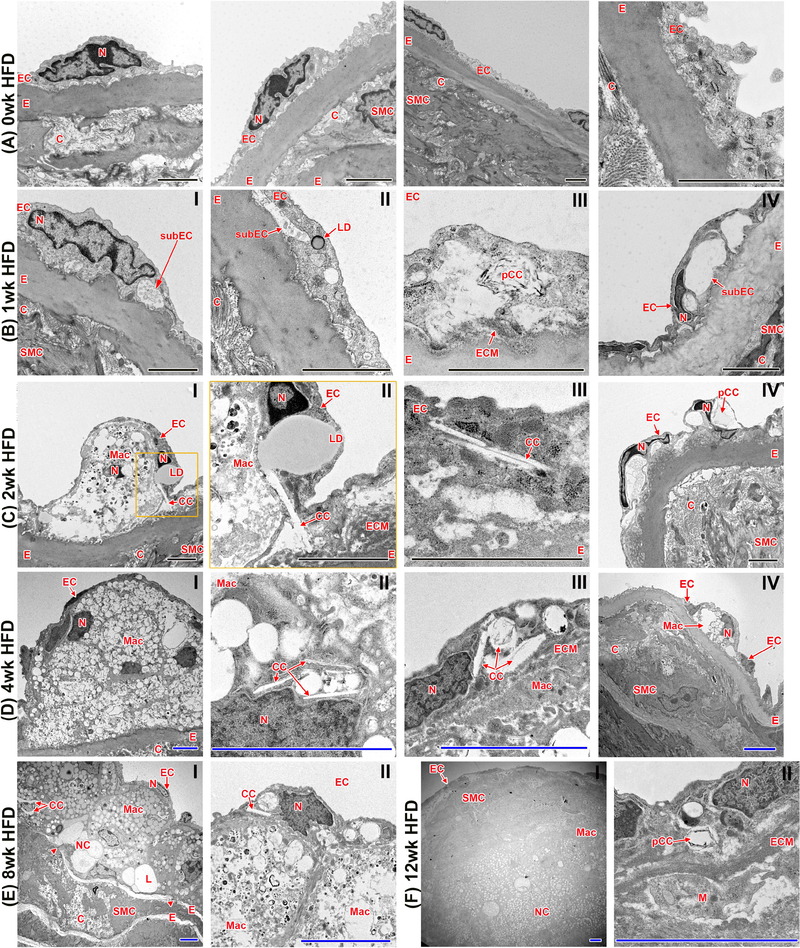
Fig. 5:
Visualization of atherogenesis at the ultrastructural level with transmission electron microscopy (TEM).
(A) Aortas of Ldlr−/− mice with no HFD show an EC layer tightly connected to the underlying internal elastic layer. (B) 1 week of HFD induces the emergence of a subendothelial space. Lipid droplets and CC clefts (spaces where cholesterol crystals have been dissolved during sample preparation) within the EC are also present. (C and D) With longer durations of HFD (2–4 weeks), increasing size of the subendothelial space can be observed. Monocytes infiltrate the subendothelial space, and CC within EC are in close contact with LD. (E and F) 8 and 12 weeks of HFD result in complex atherosclerotic plaque formation, infiltrating SMC, ECM deposition, degradation of the internal elastin layer, and necrotic core formation. C, collagen; CC, cholesterol crystal; E, internal elastic membrane; EC, endothelial cells; ECM, extracellular matrix; L, lipid; LD, lipid droplet; M, monocyte; Mac, macrophage/foam cell; N, nucleus; NC, necrotic core; pCC, possible CC; SMC, smooth muscle cells; subEC, subendothelial space. Arrowheads indicate breaks in elastin layer; black scale bar=2 μm, blue scale bar=5 μm; n=4 individual aortas for each timepoint with at least 25 pictures taken per aorta to allow for comprehensive future analysis; orange inserts indicate area of magnification to their right in orange box

