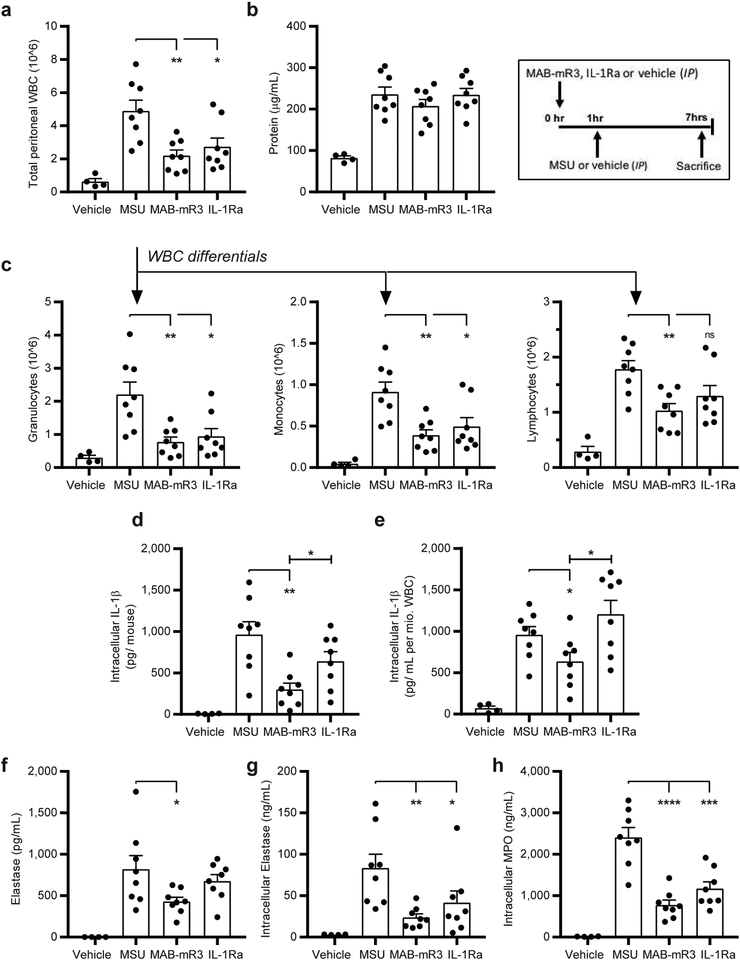
Figure 3. MAB-mR3 reduces in vivo monosodium urate crystal (MSU) mediated peritonitis.
(a) Total white blood cell count (WBC) from the peritoneal cavity (IP fluid). (b) Protein concentration in IP fluid. (c) Differential cell counts from (a) total cell influx. (ns: p=0.07) (d) Total levels per mouse of intracellular IL-1β in WBC from IP fluid. (e) Levels of intracellular IL-1β normalized per mio. WBC from IP fluid. (f) Levels of the neutrophil protease Elastase in IP fluid. (g) Total levels of intracellular Elastase in WBC from IP fluid. (h) Total levels of intracellular MPO in WBC from IP fluid. Vehicle group; vehicle+ vehicle (n=4). MSU group; vehicle+ MSU (n=8). MAB-mR3 group; MAB-mR3+ MSU (n=8). IL-1Ra group; IL-1Ra+MSU (n=8). Comparisons between inhibitor treated and MSU stimulated groups (a-h) and in-between treatment groups (d, e).
* p<0.05, ** p<0.01, *** p<0.001, **** p<0.0001 (Student’s t-test, two sided), mean ±SEM depicted.

