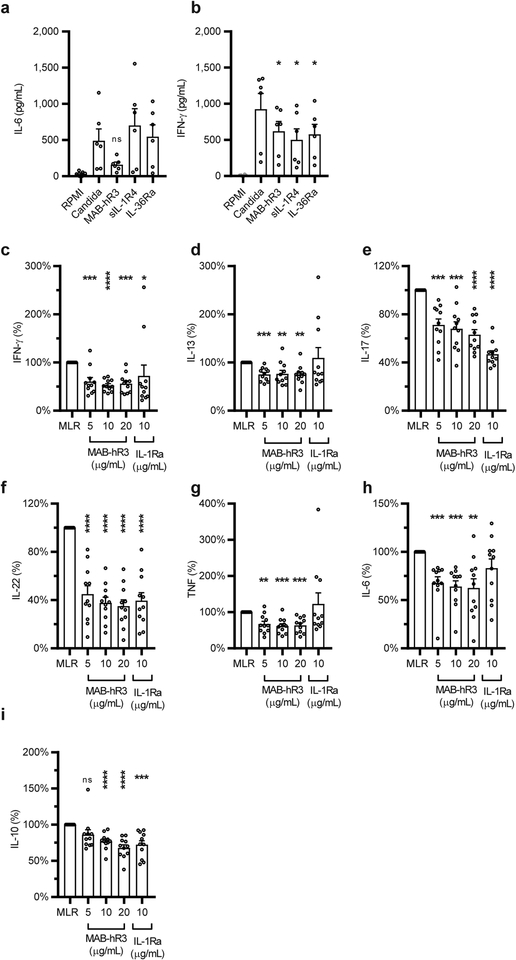
Figure 4. IL-1R3 blockade results in a broader anti-inflammatory phenotype compared to primary pathway inhibition.
(a+b) Inhibition of hk. C. albicans (0.5 ×10⁶/mL, 24hrs) induced IL-6 (-a) or IFN-γ (−b) production in PBMCs, using equal concentrations MAB-hR3, sIL-1R4 and IL-36Ra (69nM) (ns: p=0.052) (c-i) Percent change in cytokines measured in the supernatants of two-way MLRs (5-day culture). MLR range of IFN-γ (1.9–10.7 ng/mL, IL-13 (312–1808 pg/mL), IL-17 (48.6–189 ng/mL), IL-22 (143–2696 pg/mL), TNF (168−1712 pg/mL), IL-6 (254–8361 pg/mL) and IL-10 (107–1302 pg/mL) (ns: p=0.07). Inhibitors compared to stimulation or MLR alone. *p<0.05, **p<0.01, ***p<0.001, ****p<0.0001 (Paired t-test, two-sided), mean +SEM depicted. Data are from n=6 donors (a+b) and n=11 independent experiments (MLR, c-i). IL-1Ra; 10μg/mL= 578nM. MAB-hR3; 10μg/mL=69nM.

