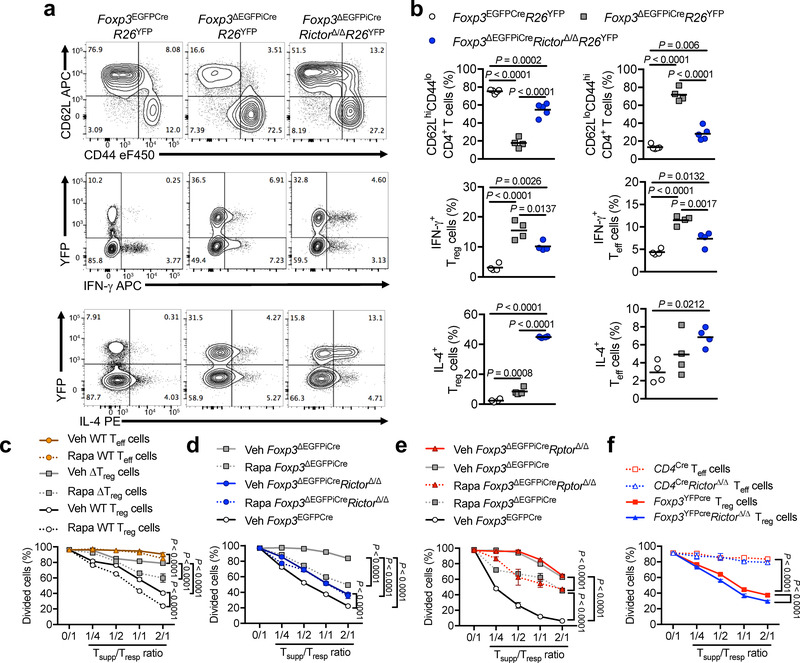
Figure 2. mTORC2 blockade endows ΔTreg cells with regulatory function.
(a,b) Representative flow cytometric analysis (a) and frequencies (scatter plots with mean) (b) of CD62LhiCD44lo and CD62LloCD44hi CD4+ T cells or IFN-γ and IL-4 expression by CD4+ Treg (YFP+) and Teff (YFP–) cells from spleen of Foxp3EGFPCreR26YFP (n=5 for CD62LhiCD44lo and CD62LloCD44hi CD4+ T cells, n=4 for IFN-γ and IL-4 expression), Foxp3ΔEGFPiCreR26YFP (n=4) and Foxp3ΔEGFPiCreRictorΔ/ΔR26YFP mice (n=5 for CD62LhiCD44lo and CD62LloCD44hi CD4+ T cells, n=4 for IFN-γ and IL-4 expression). Results represent 1 of 4 independent experiments (c) In vitro suppression of the proliferation of WT CD4+ Teff cells (denoted as T responder or Tresp) by Foxp3EGFPCre Teff cells pre-treated for 1h with DMSO (Veh WT Teff cells) or 1μM Rapamycin (Rapa WT Teff cells), Foxp3EGFPCre Treg cells pre-treated for 1h with DMSO (Veh WT Treg cells) or 1μM Rapamycin (Rapa WT Treg cells) or Foxp3ΔEGFPiCre Treg cells pre-treated for 1h with DMSO (Veh ΔTreg cells) or 1μM Rapamycin (Rapa ΔTreg cells) (denoted as T suppressor or Tsupp) (n=3 per group). Results represent 1 of 3 independent experiments (d, e) In vitro suppression of Tresp cells by Foxp3EGFPCre Treg cells (Foxp3EGFPCre), Foxp3ΔEGFPiCre Treg cells pre-treated for 1h with DMSO (Veh Foxp3ΔEGFPiCre) or 1μM Rapamycin (Rapa Foxp3ΔEGFPiCre), Foxp3ΔEGFPiCreRictorΔ/Δ Treg cells pre-treated for 1h with DMSO (Veh Foxp3ΔEGFPiCreRictorΔ/Δ) or 1μM Rapamycin (Rapa Foxp3ΔEGFPiCreRictorΔ/Δ) (n=3 per group) (Results represent 1 of 3 independent experiments) (d), and Foxp3ΔEGFPiCreRptorΔ/Δ Treg cells pre-treated for 1h with DMSO (Veh Foxp3ΔEGFPiCreRptorΔ/Δ) or 1μM Rapamycin (Rapa Foxp3ΔEGFPiCreRptorΔ/Δ) (n=3 per group) (Results represent 1 of 3 independent experiments) (e). (f) In vitro suppression of Tresp cells by Rictor-sufficient or -deficient Teff (CD4+CD25− cells from CD4cre and CD4creRictorΔ/Δ) and Foxp3-sufficient Treg (Foxp3YFPcre and Foxp3YFPcreRictorΔ/Δ) cells (n=3 per group) (Results represent 1 of 2 independent experiments). Results are expressed as mean ± SEM in panels c-f. Statistical significance was determined by a one-way ANOVA (b) or two-way ANOVA with Tukey’s multiple comparisons (c-f) (P values as indicated).

