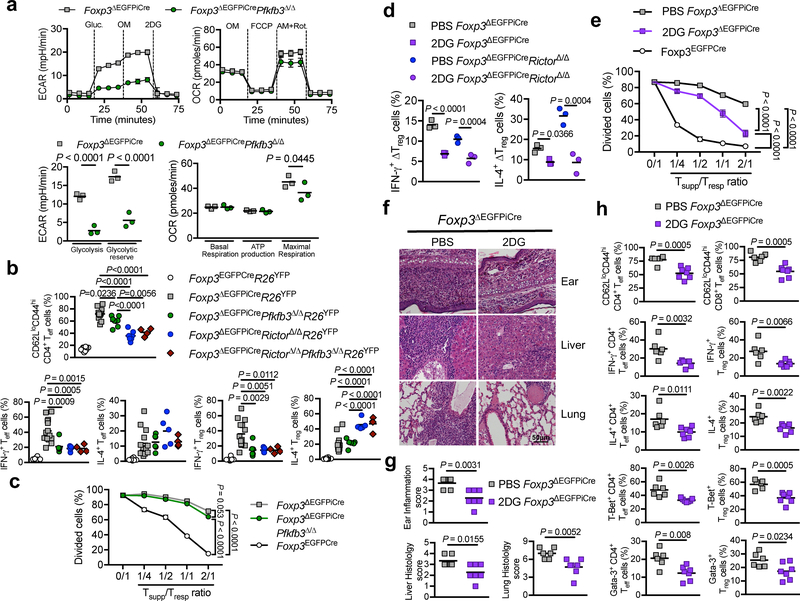
Figure 7. Blockade of glycolysis improves the scurfy phenotype of Foxp3ΔEGFPiCre mice.
(a) ECAR under glycolysis stress test conditions and OCR under mitochondrial stress test conditions of ΔTreg cells isolated from Foxp3ΔEGFPiCre or Foxp3ΔEGFPiCrePfkfb3Δ/Δ males (n=3 per group). Results are expressed as mean ± SEM and represent 1 of 2 independent experiments. (b) Frequencies of CD62LloCD44hi CD4+ Teff cells, and IFN-γ and IL-4 expression by CD4+ Treg and Teff cells in spleens of Foxp3EGFPCreR26YFP, Foxp3ΔEGFPiCreR26YFP, Foxp3ΔEGFPiCrePfkfb3Δ/ΔR26YFP, Foxp3ΔEGFPiCreRictorΔ/ΔR26YFP, Foxp3ΔEGFPiCreRictorΔ/ΔPfkfb3Δ/ΔR26YFP mice. Results are expressed as scatter plot and mean and represent a pool of 3 independent experiments. (c) In vitro suppression of CD4+ Teff cell (Tresp) proliferation by Foxp3EGFPCre, Foxp3ΔEGFPiCre or Foxp3ΔEGFPiCrePfkfb3Δ/Δ Treg cells (Tsupp) (n=3 per group). Results are expressed as mean ± SEM and represent 1 of 2 independent experiments. (d) Frequencies of IFN-γ+ and IL-4+ Foxp3ΔEGFPiCreR26YFP and Foxp3ΔEGFPiCreRictorΔ/ΔR26YFP sorted Treg cells that were either sham treated or treated ex-vivo with 2-deoxyglucose (2DG) (n=3 per group). Results are expressed as scatter plot and mean and represent 1 of 2 independent experiments. (e) In vitro suppression of CD4+ Teff cell (Tresp) proliferation by Foxp3ΔEGFPiCre ΔTreg (Tsupp) cells that were pre-treated for 12h with either PBS (Veh ΔTreg cells) or 2DG (2DG ΔTreg cells) (n=3 per group). Results are expressed as mean ± SEM and represent 1 of 2 independent experiments. (f, g) Representative hematoxylin and eosin-stained tissue histological sections (f) and tissue histological scores (g) of ears, livers and lungs of Foxp3ΔEGFPiCreR26YFP mice treated with PBS (n=) or 2 μg/g 2DG (n=) every other day from day 14 to day 28. Results are expressed as scatter plot and mean and represent a pool of 2 independent experiments. (h) Frequencies of CD62LloCD44hi CD4+ and CD8+ Teff cells, IFN-γ+ and IL-4+ Treg and CD4+ Teff cells and T-Bet+ and Gata-3+ Treg and CD4+ Teff cells in Foxp3ΔEGFPiCreR26YFP mice treated with PBS (n=6) or 2DG (n=7). Results are expressed as scatter plot and mean and represent a pool of 2 independent experiments. Statistical significance was determined unpaired t-test (g, h), one-way ANOVA with Tukey’s multiple comparisons (b) or two-way ANOVA with Sidak’s multiple comparisons (a, d) or with Tukey’s multiple comparisons (c, e) (P values as indicated).

