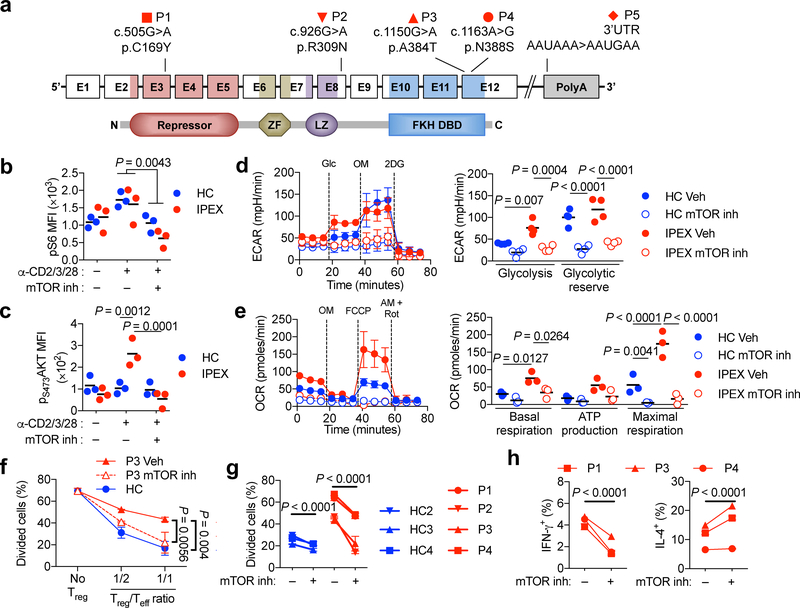
Figure 8. mTOR inhibition augments the suppressive function of human FOXP3 mutant Treg cells.
(a) Schematic representation of FOXP3 illustrating the exons, the protein domains and mapped mutations of five patients. Amino acid changes are referred to by their single letter code. The N-terminal proline rich repressor domain (Repressor), zinc finger (ZF) motif, leucine zipper domain (LZ) and the forkhead DNA-binding domain (FKH DBD) are indicated. (b,c) Mean Fluorescence Intensity (MFI) of pS6 and pS473AKT in Treg cells of healthy control subjects (HC) (n=3) and IPEX patients (n=3; P1, P2, P3) stimulated with anti-CD2/CD3/CD28 mAbs (α-CD2/3/28) in the absence or presence of a competitive dual mTOR inhibitor (mTOR inh). Results are expressed as scatter plot and mean and represent 1 of 2 independent experiments. (c) Representative ECAR tracings (HC1 and P1), expressed as mean ± SEM. (d) Evaluation of glycolysis and glycolytic reserve (n=5 each for HC and IPEX groups). Results are expressed as mean ± SEM and represent a pool of 5 independent experiments. (e) Representative OCR tracings (HC2 and P2). Basal respiration, ATP production and maximal respiration in DMSO (Vehicle) or mTOR inhibitor (mTOR inh) treated HC and IPEX Treg cells (HC n=3 and IPEX: P1, P2, P4). (f) In vitro suppression of third party CD4+ Teff cell (Tresp) proliferation by Treg (Tsupp) cells of a HC or an IPEX subject (P3) that were pre-treated with vehicle or mTOR inhibitor. (g) Compilation of in vitro suppression assay results for HC and IPEX subjects at the ratio of 1:1 Treg:Teff cells without or with Treg cell mTOR inhibitor pretreatment. (h) IFN-γ and IL-4 secretion by vehicle or mTOR inhibitor pre-treated IPEX Treg cells. Statistical significance was one-way ANOVA with Tukey’s multiple comparisons (h) or two-way ANOVA with Sidak’s multiple comparisons (b-d) or with Tukey’s multiple comparisons (e, f, g) (P values as indicated).

