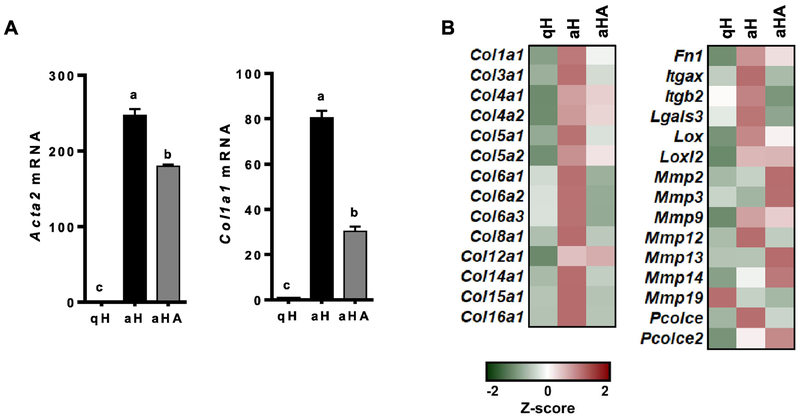
Figure 1.
The expression of fibrogenic genes was higher in aHSCs than qHSCs, which was attenuated by ASTX. HSCs were isolated from mice and cultured for 1 day or 7 days to represent qHSCs (qH) or aHSCs (aH), respectively. ASTX (25 μM) was added during HSC activation for 7 days (aHA). RT-qPCR analysis for fibrogenic genes (A), heatmap of fibrogenic genes from RNAseq analysis (B).

