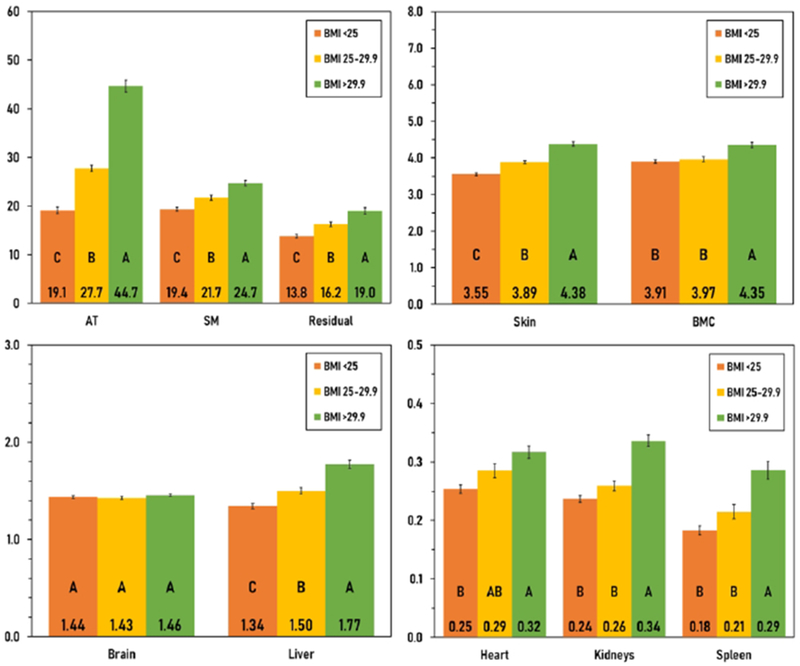
Figure 2.

Organ and tissue mass, expressed in kg, of the three body mass index (BMI, kg/m2) groups for women. The group mean mass (±SE) of each component is shown in the vertical bars along with the Tukey letters corresponding to each group (between-group significant differences are denoted by different letters). Brain mass did not differ significantly between the groups of women who were normal weight and obese. Additional numerical details are presented in Table 3. AT, adipose tissue; BMC, bone mineral content; SM, skeletal muscle.
