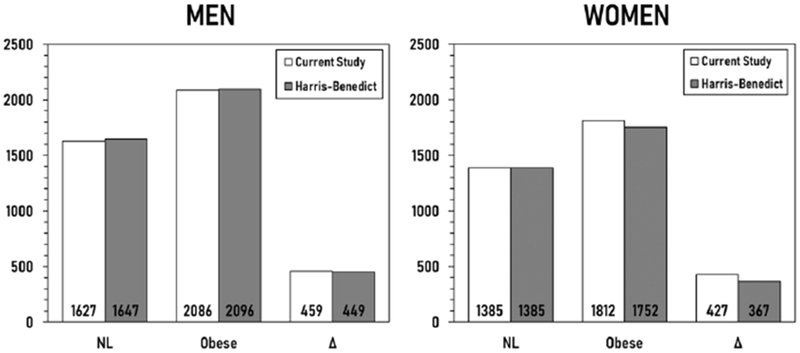
Figure 3.

Composition of obesity tissue, in percent, observed in the men (upper left) and women (lower left). Percentage contributions to resting energy expenditure (REE) for the men (upper right) and women (lower right). Additional numerical details are presented in Table 3.
