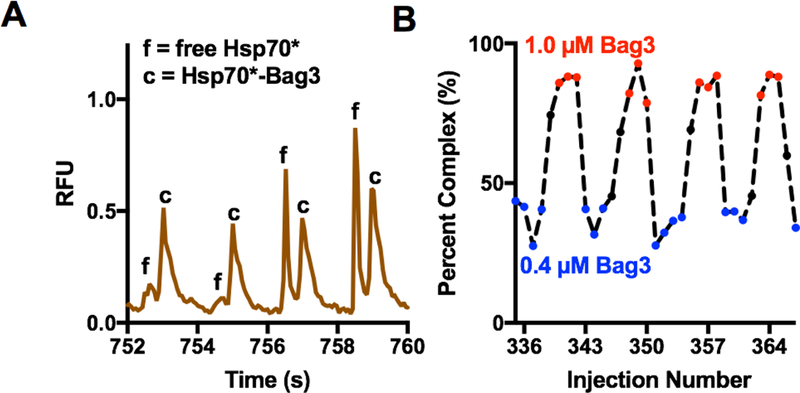
Figure 5.

Electrophoresis and performance of density-based oil drain for analysis of Hsp70*-Bag3 samples by microchip gel electrophoresis. (A) Four concatenated sample electropherograms, taken from the trace in ESM Fig. S2A, for separation of Hsp70* (f) from Hsp70*-Bag3 complex (c). (B) Quantification of relative percent Hsp70*-Bag3 complex present in each electropherogram. Red indicates 1 µM Bag3 and blue indicates 0.4 µM Bag3.
