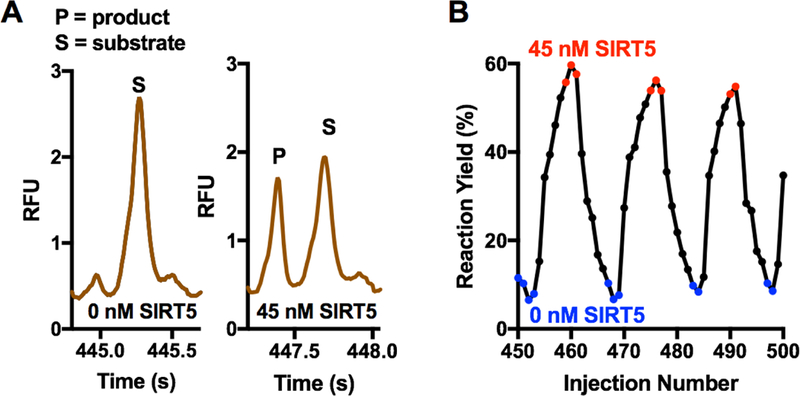
Figure 7.

Electrophoresis and performance of density-based oil drain for analysis of SIRT5 reaction samples by free-solution microchip electrophoresis. (A) Raw trace collected for individual electropherograms, taken from the trace in ESM Fig. S4A, showing an example with 45 nM SIRT5 and no SIRT5. (B) Selection of a sequence of yields from electropherograms to better illustrate the transition from 0 to 45 nM SIRT5. Red indicates data from electropherograms of samples with 45 nM SIRT5 (red) and blue indicates no SIRT5. These colors correspond to the colored points in ESM Fig. S4. Electropherograms from transition between droplets are in black.
