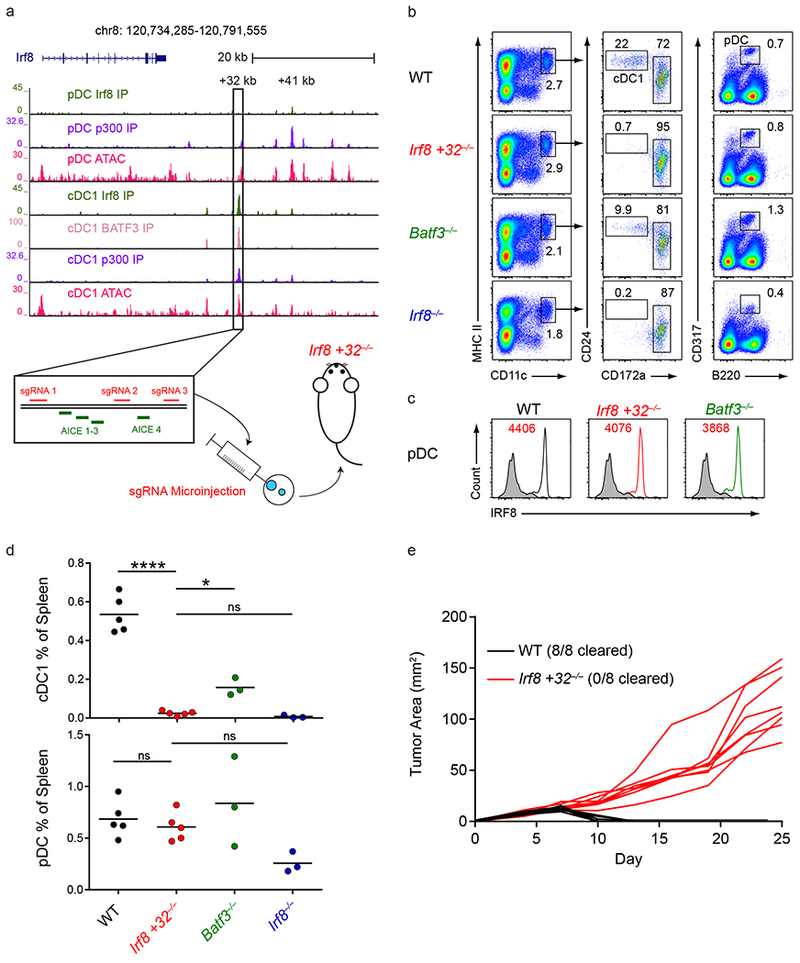
Figure 1. The +32 kb Irf8 enhancer is required for cDC1 development.

a, Normalized sequencing tracks of ChIP-seq with anti-p300, anti-BATF3, or anti-IRF8 antibodies or of ATAC-seq in the indicated populations. Boxed is the +32 kb Irf8 enhancer. Shown below is the +32 kb Irf8 enhancer with the AICE motifs and sgRNA target sequences depicted. Data are pooled from two independent experiments and the Immunological Genome Project Open Chromatin Regions (n = 1 biological replicate per population). b, Flow cytometry of live splenocytes from mice of the indicated genotypes was used to identify dendritic cell (DC) subsets. Numbers indicate the percent of cells in the indicated gates. Data are representative of four independent experiments with similar results (n = 5 mice for WT, n = 5 mice for Irf8 +32−/−, n = 3 mice for Batf3−/−, and n = 3 mice for Irf8−/−). c, Intracellular staining for IRF8 in splenic pDCs of mice of the indicated genotypes. Numbers indicate the mean fluorescence intensity (MFI) of IRF8 protein levels in pDCs. Data are representative of four independent experiments with similar results (n = 5 mice for WT, n = 5 mice for Irf8 +32−/−, n = 3 mice for Batf3−/−, and n = 3 mice for Irf8−/−). d, Statistical analysis of the frequency of splenic cDC1s and pDCs in mice of the indicated genotypes. Small horizontal lines indicate the mean. Data are pooled from four independent experiments (n = 5 mice for WT, n = 5 mice for Irf8 +32−/−, n = 3 mice for Batf3−/−, and n = 3 mice for Irf8−/−). e, Growth of 1969 regressor fibrosarcomas in WT and Irf8 +32 kb−/− mice. Data are pooled from two independent experiments (n = 8 mice for WT, n = 8 mice for Irf8 +32−/−). ns, not significant (P>0.05); *P<0.05; ****P<0.0001, ordinary one-way ANOVA (d).
