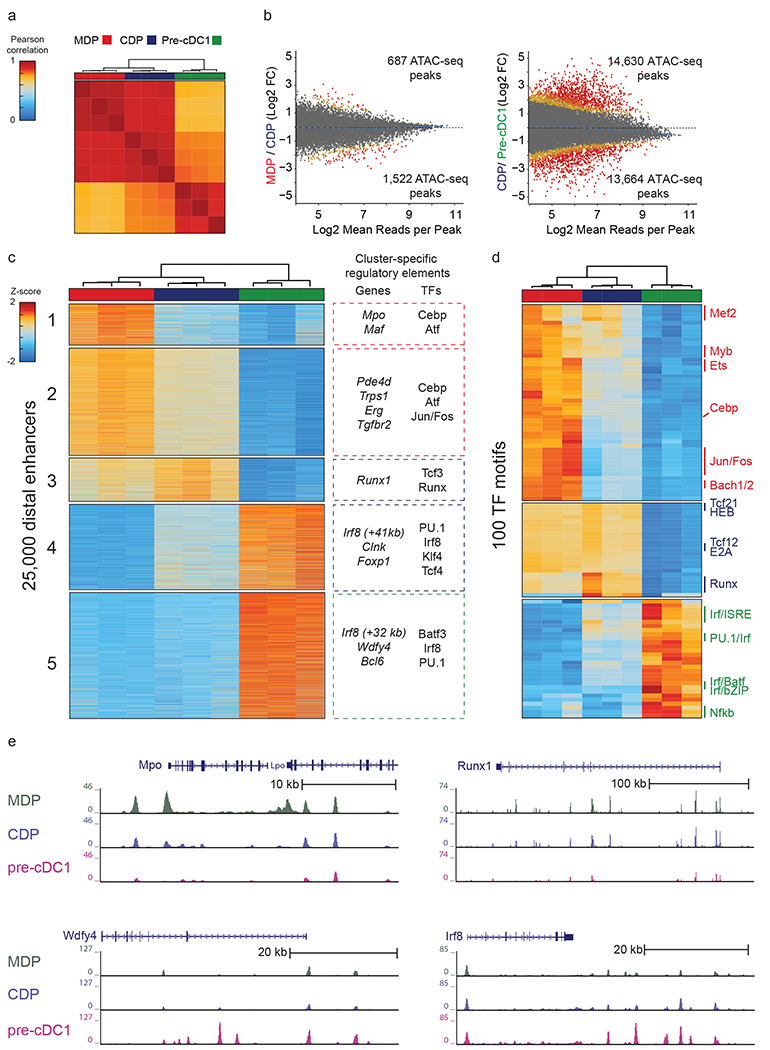
Figure 5. ATAC-seq identifies the +41 kb Irf8 enhancer as transiently active in cDC1 progenitors.

a, Pearson correlation of all distal ATAC-seq peaks for the indicated populations. Data are pooled from three independent experiments (n = 3 biological replicates per population). b, Differential ATAC-seq peaks in the indicated populations. Colors indicate orders of significance derived from DESeq2 analysis, with grey (fdr>0.1), yellow (0.1>fdr>0.01) , orange (0.01>fdr>0.001), and red (fdr<0.001) . Data are pooled from three independent experiments (n = 3 biological replicates per population). c, Heat map of k-means clusters for the top 25,000 varying distal ATAC-seq peaks. Colors indicate z-scores of reads in each peak compared with mean reads across all populations. Genes nearest to the clustered peaks and transcription factor motifs (TFs) enriched within peaks are indicated. Data are pooled from three independent experiments (n = 3 biological replicates per population). d, Heat map of k-means clusters of TF deviation z-scores for ATAC-seq profiles of the indicated populations. Data are pooled from three independent experiments (n = 3 biological replicates per population). e, Normalized sequencing tracks of ATAC-seq in the indicated populations are shown for genes in each k-means cluster. Mpo was present in k-cluster 1, Runx1 was present in k-cluster 3, Wdfy4 was present in k-cluster 4, and Irf8 was present in k-clusters 4 and 5. Data are representative of three independent experiments with similar results (n = 3 biological replicates per population).
