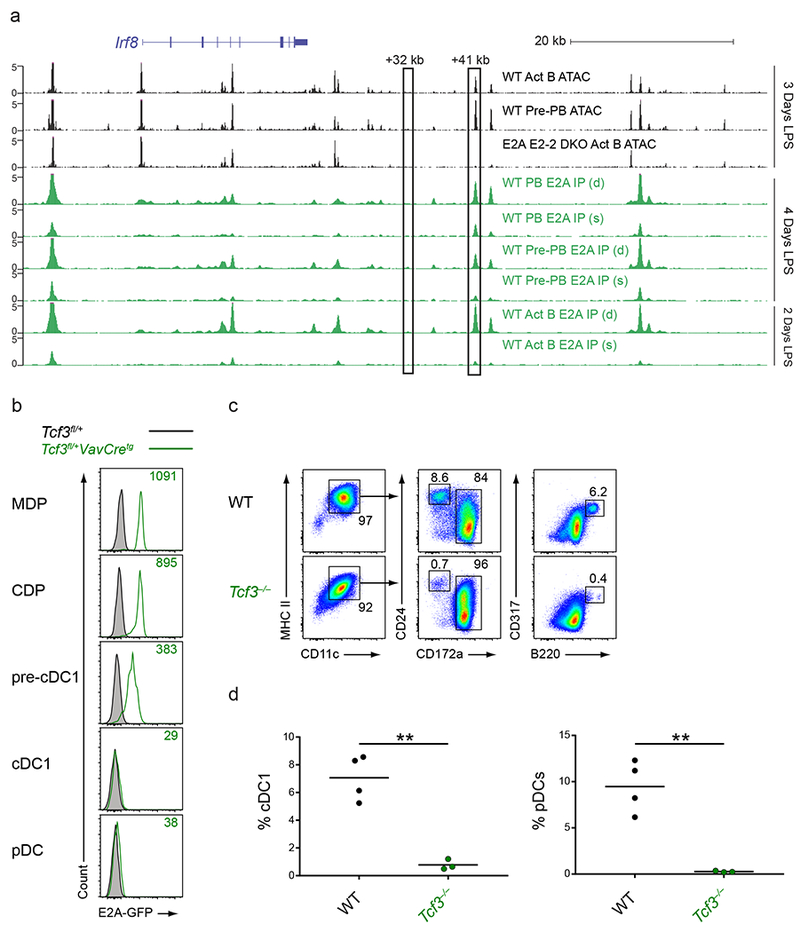
Figure 7. E proteins are involved in the development of cDC1s and pDCs.

a, Normalized sequencing tracks of ChIP-seq with anti-E2A antibody or of ATAC-seq in lymph node B cells activated by LPS for the indicated number of days. Boxed are the +32 kb and +41 kb Irf8 enhancers. Populations analyzed were activated B cells (CD22+CD138−; Act B), pre-plasmablasts (CD22−CD138−; pre-PB), and plasmablasts (CD22−CD138+; PB) from either WT or Tcf3−/−Tcf4−/− (E2A E2-2 DKO) mice. B cells were either single (s)- or double (d)- crosslinked followed by ChIP with an E2A antibody as indicated. Data are pooled from two independent experiments (n = 1 biological replicate per population and per condition). b, Flow cytometry of Lin−CD135+ BM cells or live splenocytes from mice of the indicated genotypes was used to determine intracellular E2A-GFP levels in the indicated populations. Numbers indicate the MFI of E2A-GFP levels. Data are representative of four independent experiments with similar results (n = 3 mice for Tcf3fl/+ and n = 6 mice for Tcf3fl/+VavCretg). c,d, BM cells from WT or Tcf3−/− mice were cultured for 9 days in Flt3L. Cells were then analyzed by flow cytometry to identify DC subsets. Numbers indicate the percent of cells in the indicated gates (c). Statistical analysis of the frequency of cDC1s and pDCs from cultures is shown (d). Small horizontal lines indicate the mean. Data are pooled from three independent experiments (n = 3 mice for WT and n = 3 mice for Tcf3−/−). **P<0.01, unpaired two-tailed Student’s t-test (d).
