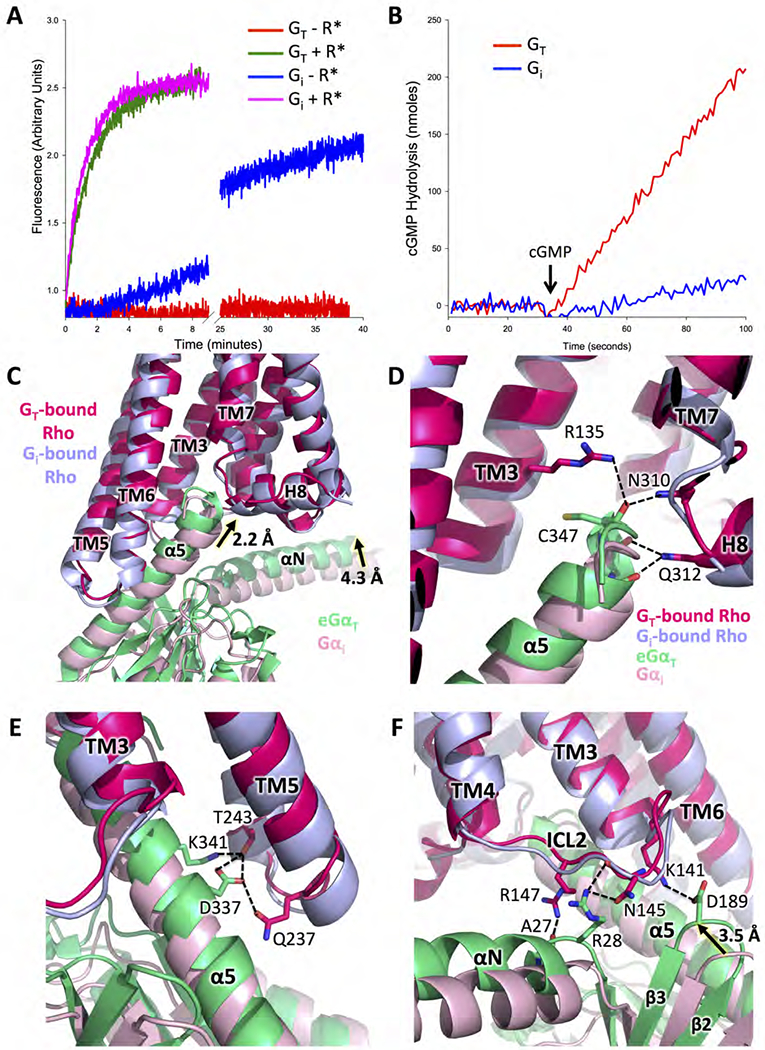
Figure 2. Comparison between the Rho-GT and Rho-Gi complexes.

(A) Basal and Rho-catalyzed nucleotide exchange activities for GT and Gi, as monitored by the changes in Trp fluorescence that accompany G protein activation (GT: basal exchange in red, Rho-catalyzed exchange in green; Gi: basal exchange in blue, Rho-catalyzed exchange in magenta). (B) Comparisons of cyclic GMP hydrolysis by the cGMP phosphodiesterase 6 (PDE6), the physiological effector of GT, as stimulated by GTPγS-bound GT, versus GTPγS-bound Gi (GT in red, Gi in blue). (C) Comparison of Gα subunit conformation based on receptor alignment in the structures of the Rho-GT and the Rho-Gi complexes (PDB: 6CMO). eGαT inserts deeper into Rho than Gαi, allowing for more extensive interactions (GT-bound Rho in strawberry, Gi-bound Rho in light blue, eGαT in lime, Gαi in pink). (D) Interactions between the C terminus of eGαT and Rho compared to the same region in the Rho-Gi complex. (E) Interactions between the α5 helix of eGαT and TM5, TM6 of Rho compared to the same region in the Rho-Gi complex. (F) Interactions between ICL2 of Rho and eGαT compared to the same region in the Rho-Gi complex.
See also Figures S1, S2 and S6.
