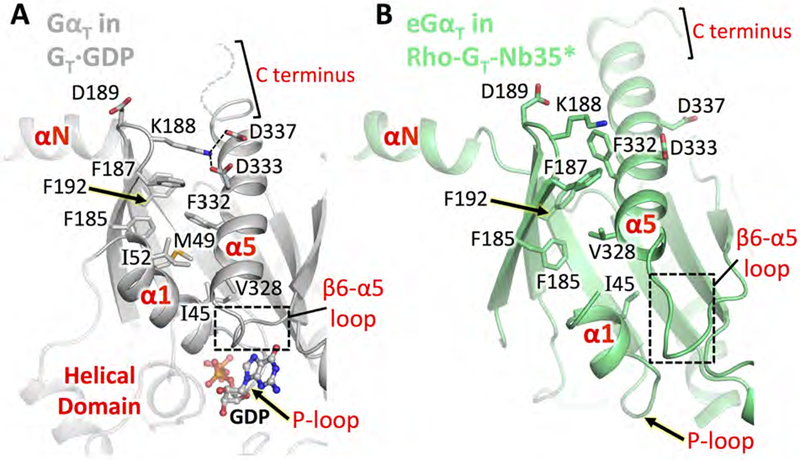
Figure 3. Conformational changes in the α5 helix and its surrounding regions upon Rho engagement.

Comparison of Ras domain structural elements in GT·GDP and Rho-GT-Nb35*. (A) GαT in GT·GDP (PDB: 1GOT, grey). Residues 344-LKDCGLF-350 at the C terminus are shown as a dashed curve as they are not resolved in the GT·GDP crystal structure. The helical domain is shown as a transparent cartoon for reference. (B) eGαT in the Rho-GT-Nb35* complex (lime) aligned to GT·GDP based on Gβ1γ1.
See also Figures S3 and S5.
