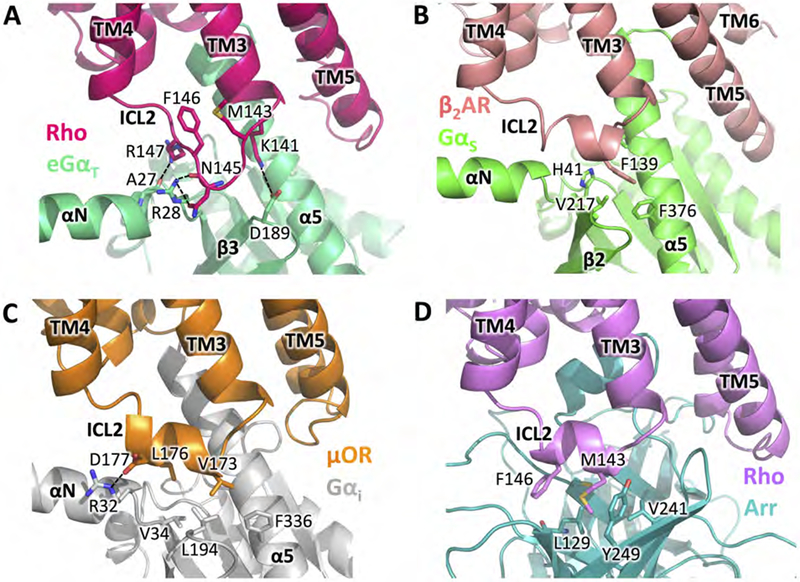
Figure 4. Comparisons of ICL2 in the Rho-GT-Nb35* complex and other GPCR complexes.

(A) Conformation of ICL2 in GT-bound Rho and its interactions with eGαT in the Rho-GT-Nb35* complex (GT-bound Rho in strawberry, GαT in lime). (B) Conformation of ICL2 in β2AR and its interactions with GαS in the β2AR-GS complex (PDB: 3SN6) (β2AR in salmon, GαS in green). (C) Conformation of ICL2 in μOR and its interactions with Gαi in the μOR-Gi complex (PDB: 6DDF) (μOR in orange, Gαi in grey). (D) Conformation of ICL2 in arrestin-bound Rho and its interactions with arrestin in the Rho-arrestin complex (PDB: 4ZWJ) (arrestin-bound Rho in purple, arrestin in teal).
See also Figure S6.
