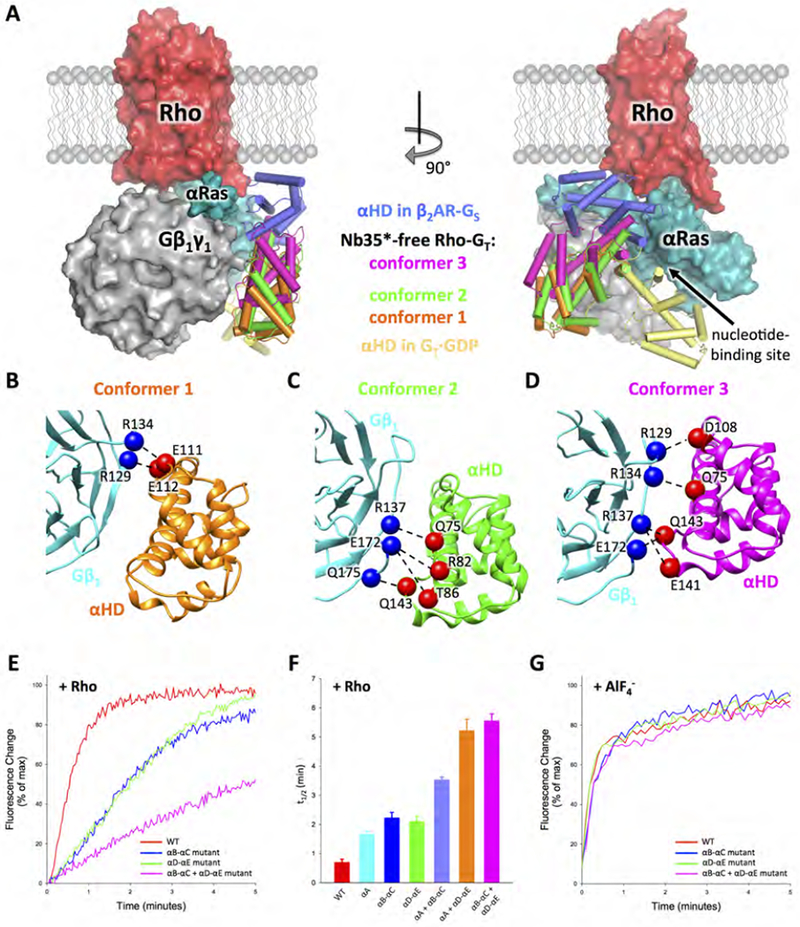
Figure 6. GαT Helical domain conformations in the Nb35*-free Rho-GT complex.

(A) Orthogonal views of the complex with the rGαT helical domain (αHD) in the three observed distinct conformations (colored in orange, green and purple respectively) compared to the conformations of the helical domain observed in the β2AR-GS complex (PDB: 3SN6, dark blue) and GDP-bound GT (PDB: 1GOT, yellow) crystal structures. The comparison is based on the Gα Ras domain alignment. Rho (red), Gβlγ1 (grey) and rGαT Ras domain (cyan) are from the 3.9 Å Nb35*-free complex structure. (B-D) Interactions between αHD and Gβ1 revealed by docking the αHD crystal structure (PDB: 1GOT) and the Gβ1 structure from the 3.9 Å Nb35*-free Rho-GT complex into the three 4.5 Å Nb35*-free complex cryo-EM maps. Gβ1 is colored in cyan. αHD is colored in orange, green and purple, respectively, in three different conformers. Residues from Gβ1 and αHD, that are positioned to form contacts, are shown as blue and red spheres respectively. (E) Trp fluorescence assay monitoring Rho-catalyzed nucleotide exchange in wild-type rGαT (red), the rGαT helical domain mutants changing αB-αC loop residues (E111A, E112A) (blue), αD-αE loop residues (E141A, Q143A) (green) or residues from both αB-αC loop and αD-αE loop (D108A, E111A, E112A, E141A, Q143A) (magenta). (F) t1/2 (time needed for 50% of the fluorescence change to occur) of Rho-catalyzed nucleotide exchange in rGαT wild-type and mutants from Figure 6E, and the rGαT helical domain mutants (fluorescence curves shown in Figure S7E) changing αA helix residues (Q75A, R82A, T86A) (cyan), residues from both αA helix and αB-αC loop (Q75A, R82A, T86A, D108A, E111A, E112A) (light blue), or residues from both αA helix and αD-αE loop (Q75A, R82A, T86A, E141A) (orange). Data represents mean ± SEM (n=3). (G) Trp fluorescence assay monitoring response to the addition of AlF4− in both wild-type and mutant GαT (color scheme the same as in Figure 6E).
See also Figures S4, S7 and Tables S2 and S3.
